

Summary
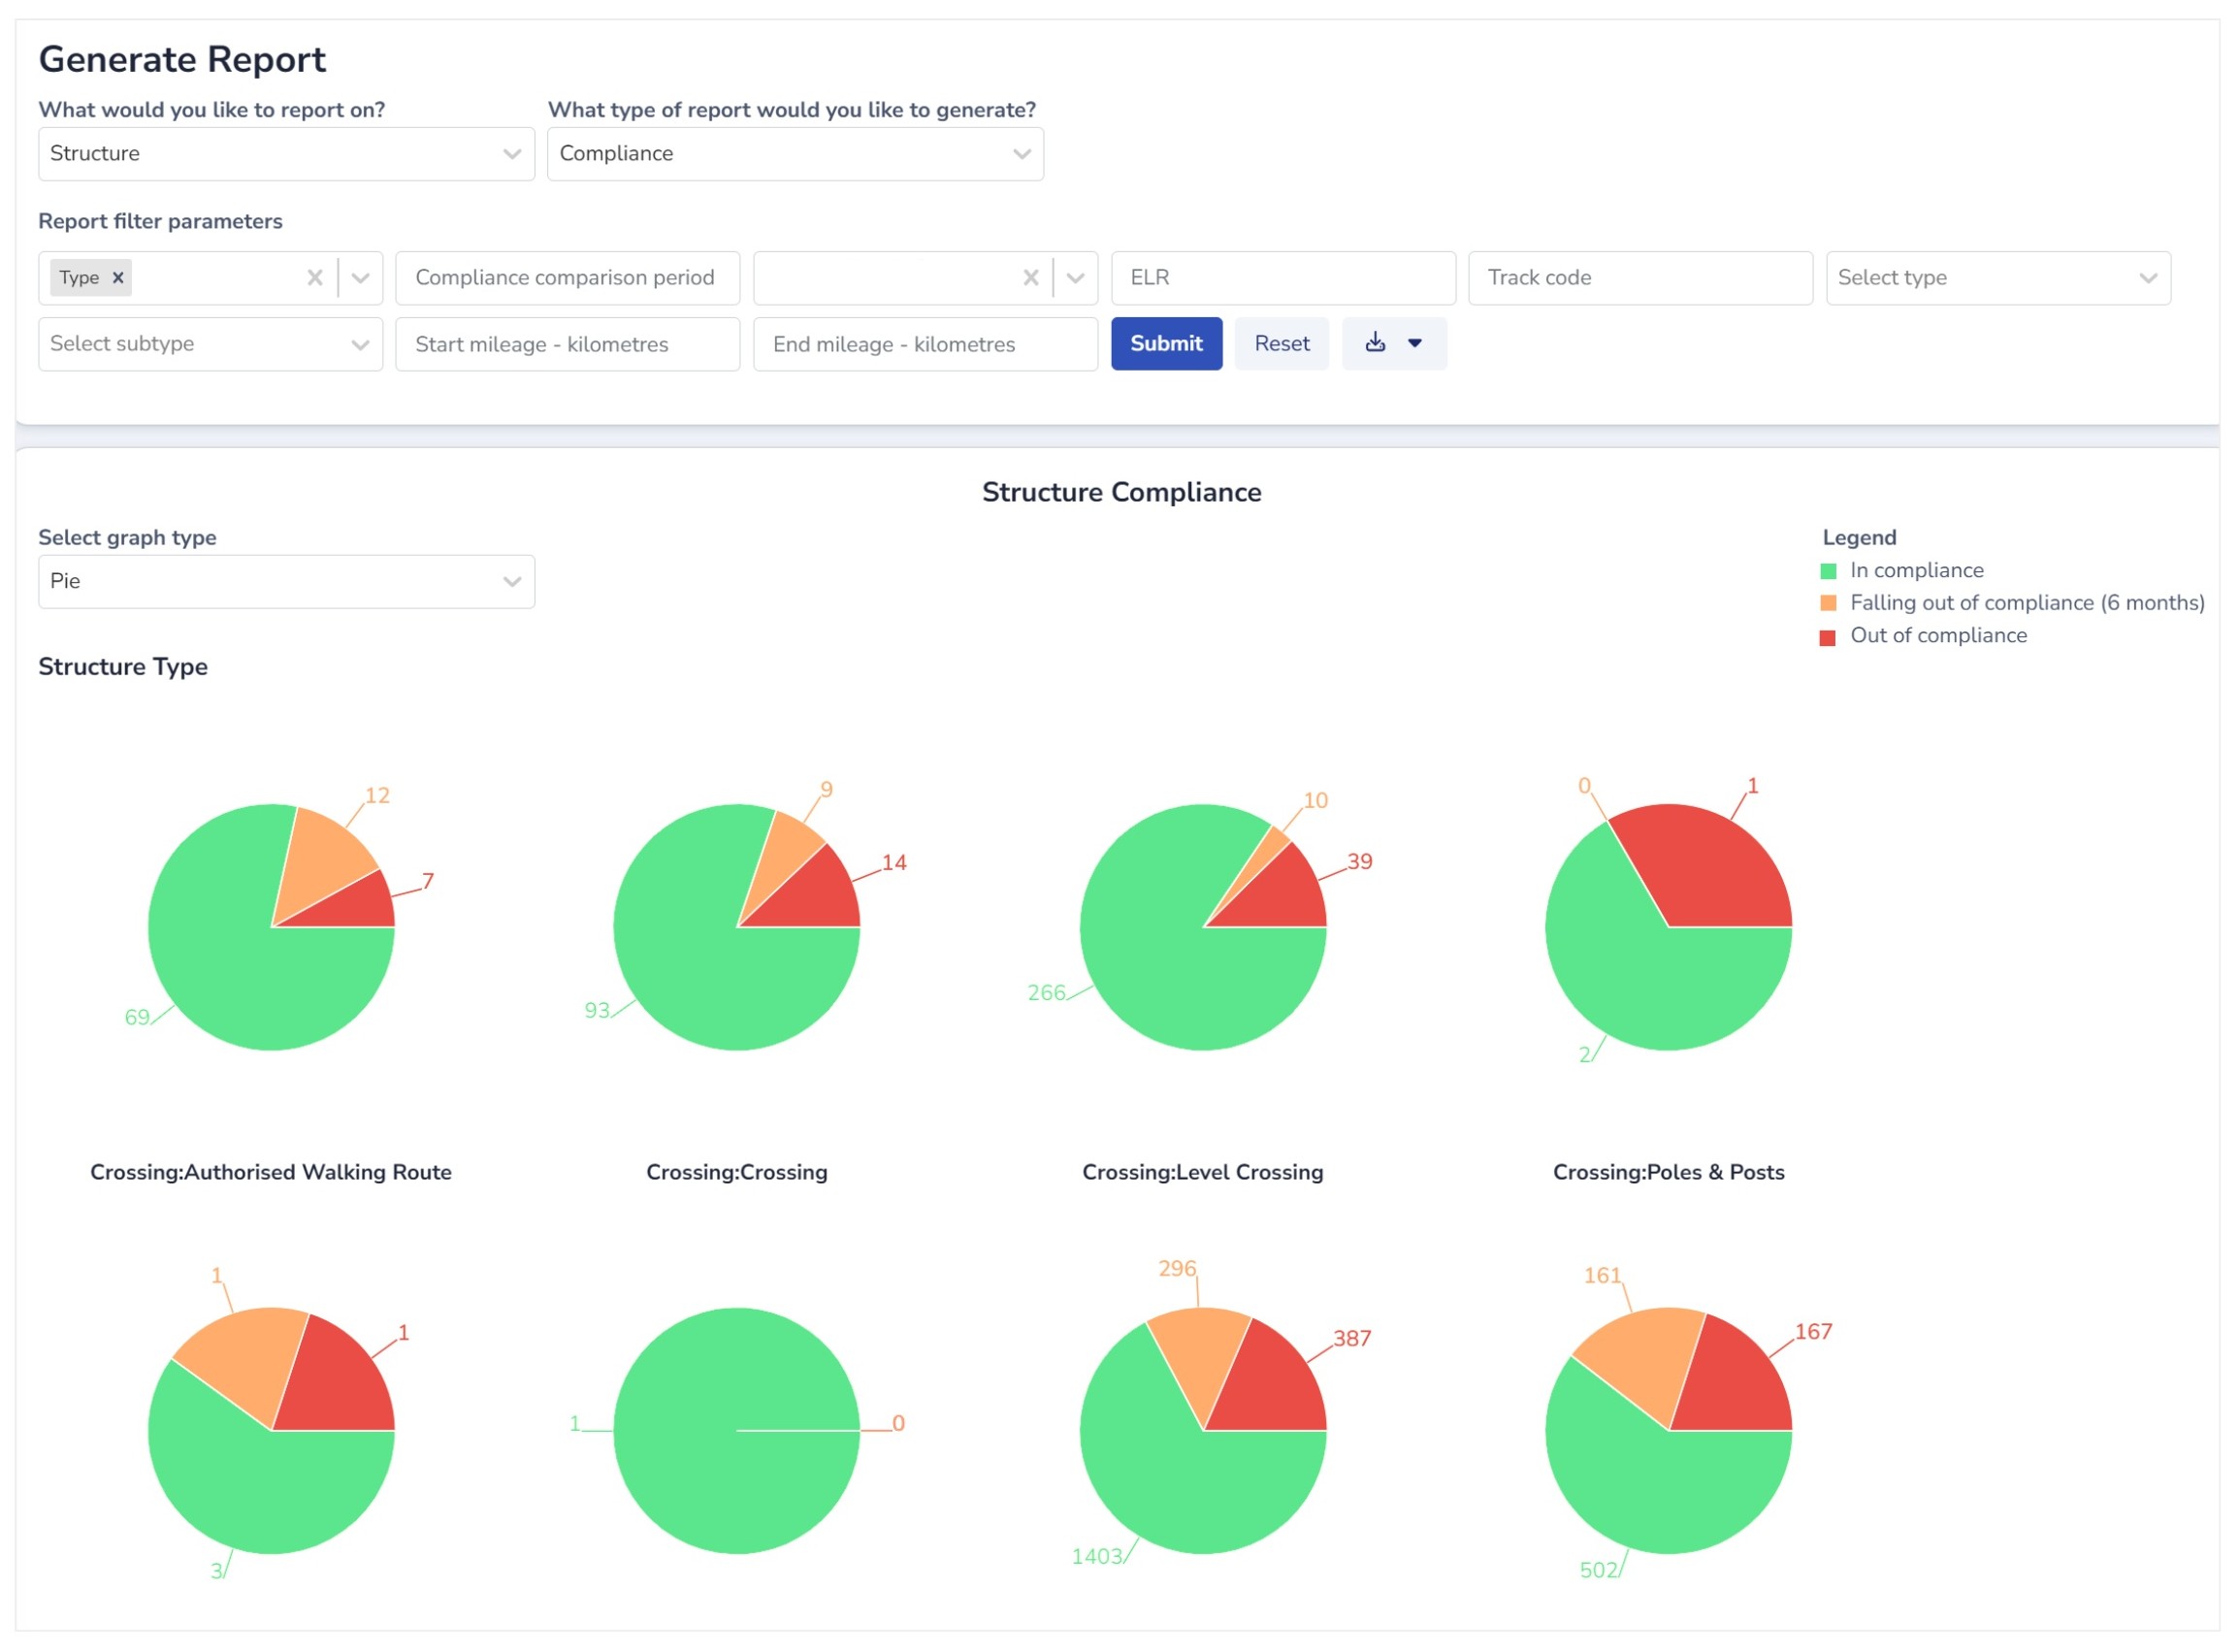
The Structure Compliance Report displays the compliance status of structures recorded in the Network Model. It shows how many structures are in compliance, falling out of compliance, or out of compliance — filtered by location, structure type, or administrative grouping.
Results are displayed as charts which can be grouped in a multitude of ways, depending on user workflows and preferences. Each chart shows a breakdown of structure counts by compliance status.
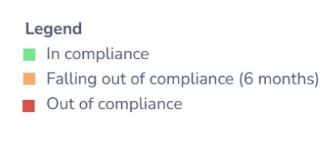
Compliance Status Categories
|
Status |
Description |
|---|---|
|
In compliance |
Structure has been surveyed within its required inspection period. |
|
Falling out of compliance |
Structure has not been surveyed recently, with its required inspection date approaching. |
|
Out of compliance |
Structure has not been surveyed recently, and its required inspection date has lapsed. |
How to generate the report
-
Go to Reporting
-
Set "What would you like to report on?" to Structure
-
Set "What type of report would you like to generate?" to Compliance
-
Select the report grouping category to be displayed
-
Apply any required filters
-
Click Submit
Report Grouping Categories
The grouping selection controls how the report is structured. Each selected grouping produces a separate set of charts showing one chart per item.
|
Grouping |
What it shows |
Typical use |
|---|---|---|
|
Network Level |
A single aggregate view across the entire network. |
Executive overview. |
|
Region |
One chart per region. |
Comparing regional compliance performance. |
|
Route |
One chart per route. |
Identifying routes with the highest non-compliance. Typically filtered show routes in one region. |
|
Track |
One chart per track. |
Planning surveys at the track level. |
|
Type |
One chart per structure type (e.g. Crossing, Tunnel, Platform). |
Planning surveys of a particular structure type. |
|
Clearance Category |
One chart per clearance classification. |
Reviewing compliance by clearance risk level. |
Multiple groupings can be selected at once. Each grouping produces its own section in the results.
Compliance Comparison Period
The compliance comparison period sets the number of months used to determine whether a structure is "falling out of compliance." For example, entering 6 means any structure due to fall out of compliance within the next 6 months will appear in the amber category.
This value is reflected in the chart legend (e.g. Falling out of compliance (6 months)).
Report Filters
|
Filter |
Description |
|---|---|
|
Type |
Filters by structure type (e.g. Crossing, Platform, Tunnel). |
|
Sub-Type |
Filters by structure sub-type. Available after a Type is selected. |
|
Region |
Filters to a specific administrative region. |
|
Route |
Filters to a specific route (ELR) within the Network Model. |
|
Track |
Filters to a specific track. |
|
Start distance / End distance |
Filters to a mileage range along the selected route or track, in kilometres. |
Reading the Results
-
Each chart represents each item in the selected group.
-
Segments show the count of structures in each compliance status.
-
The number on each segment is the structure count for that status.
-
Charts displaying only a red segment indicate all structures in that category are currently out of compliance.
Graph Types
Use the Select graph type dropdown to change how results are displayed.
|
Option |
Description |
|---|---|
|
Pie |
Default view. Shows compliance split per structure type as a pie chart. |
|
Bar |
Displays compliance counts as grouped bars per structure type. |
|
Stacked bar |
Shows compliance counts stacked within a single bar per structure type. |
|
Table |
Displays results as a data table. |
Export
Click the download icon to export the results as a .CSV file.