

The Gauging Productivity Report is a self‑serve actions‑based export that gives managers a quantitative view of productivity over a selected period.
The report is designed to provide quantitative information on:
-
Throughput: How much work was completed in the period?
-
Complexity: What types of actions were required to complete that work?
Note: This report is intentionally action-based rather than effort-estimated. It reflects what was objectively completed, not inferred time-on-task. Any resourcing or forecasting models built on top of this data should make their assumptions explicit.
Accessing the report in the platform
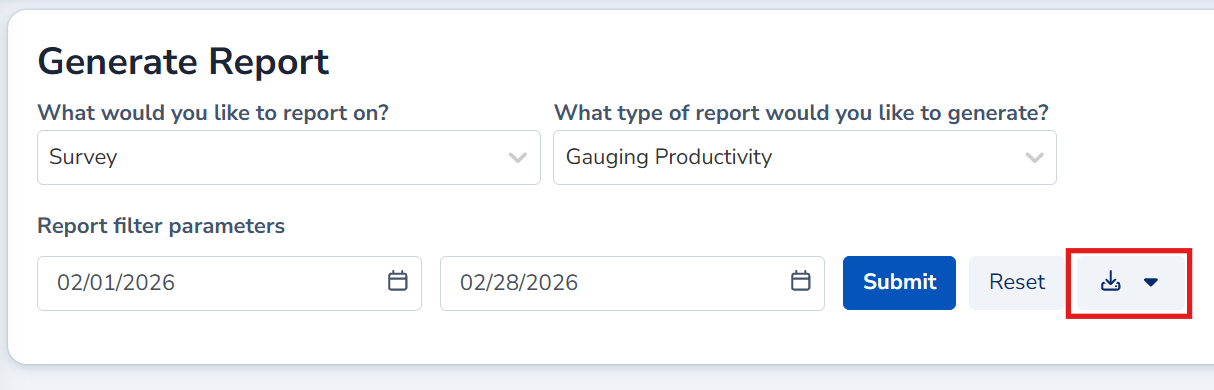
You can generate Gauging Productivity reports directly in the Reporting area of the platform (subject to permissions).
-
Set:
-
What would you like to report on:
Survey -
What type of report would you like to generate:
Gauging Productivity
-
-
Select a start date and end date (day granularity).
-
Click Submit.
-
Click Download to export the CSV.
Date range and filtering
The report is bounded to the selected date range (inclusive) and defaults to the last 30 days if no dates are provided.
Note: The date range cannot exceed 60 days. This ensures fast, reliable report generation.
-
The report is anchored on surveys that transitioned to
Publishedwithin the selected date range (using thePublishedDatefilter). -
Productivity signals are derived from user actions taken against those published surveys (via audit events), and attributed to individual users.
This means that if a team does work on a survey but it is not Published until a later date, that work will only appear once the publish date falls within the chosen reporting period.
Permissions and appropriate use
Because this report can be interpreted as providing individual‑level performance metrics, it should be treated as sensitive.
We recommend that you:
-
Grant access only to authorised managers or leads.
-
Establish an internal policy covering:
-
Who is allowed to run the report.
-
Who the output can be shared with.
-
How the report should and should not be used (for example, coaching and workload management vs. formal HR performance measures).
-
Understanding the Report Display
Legend
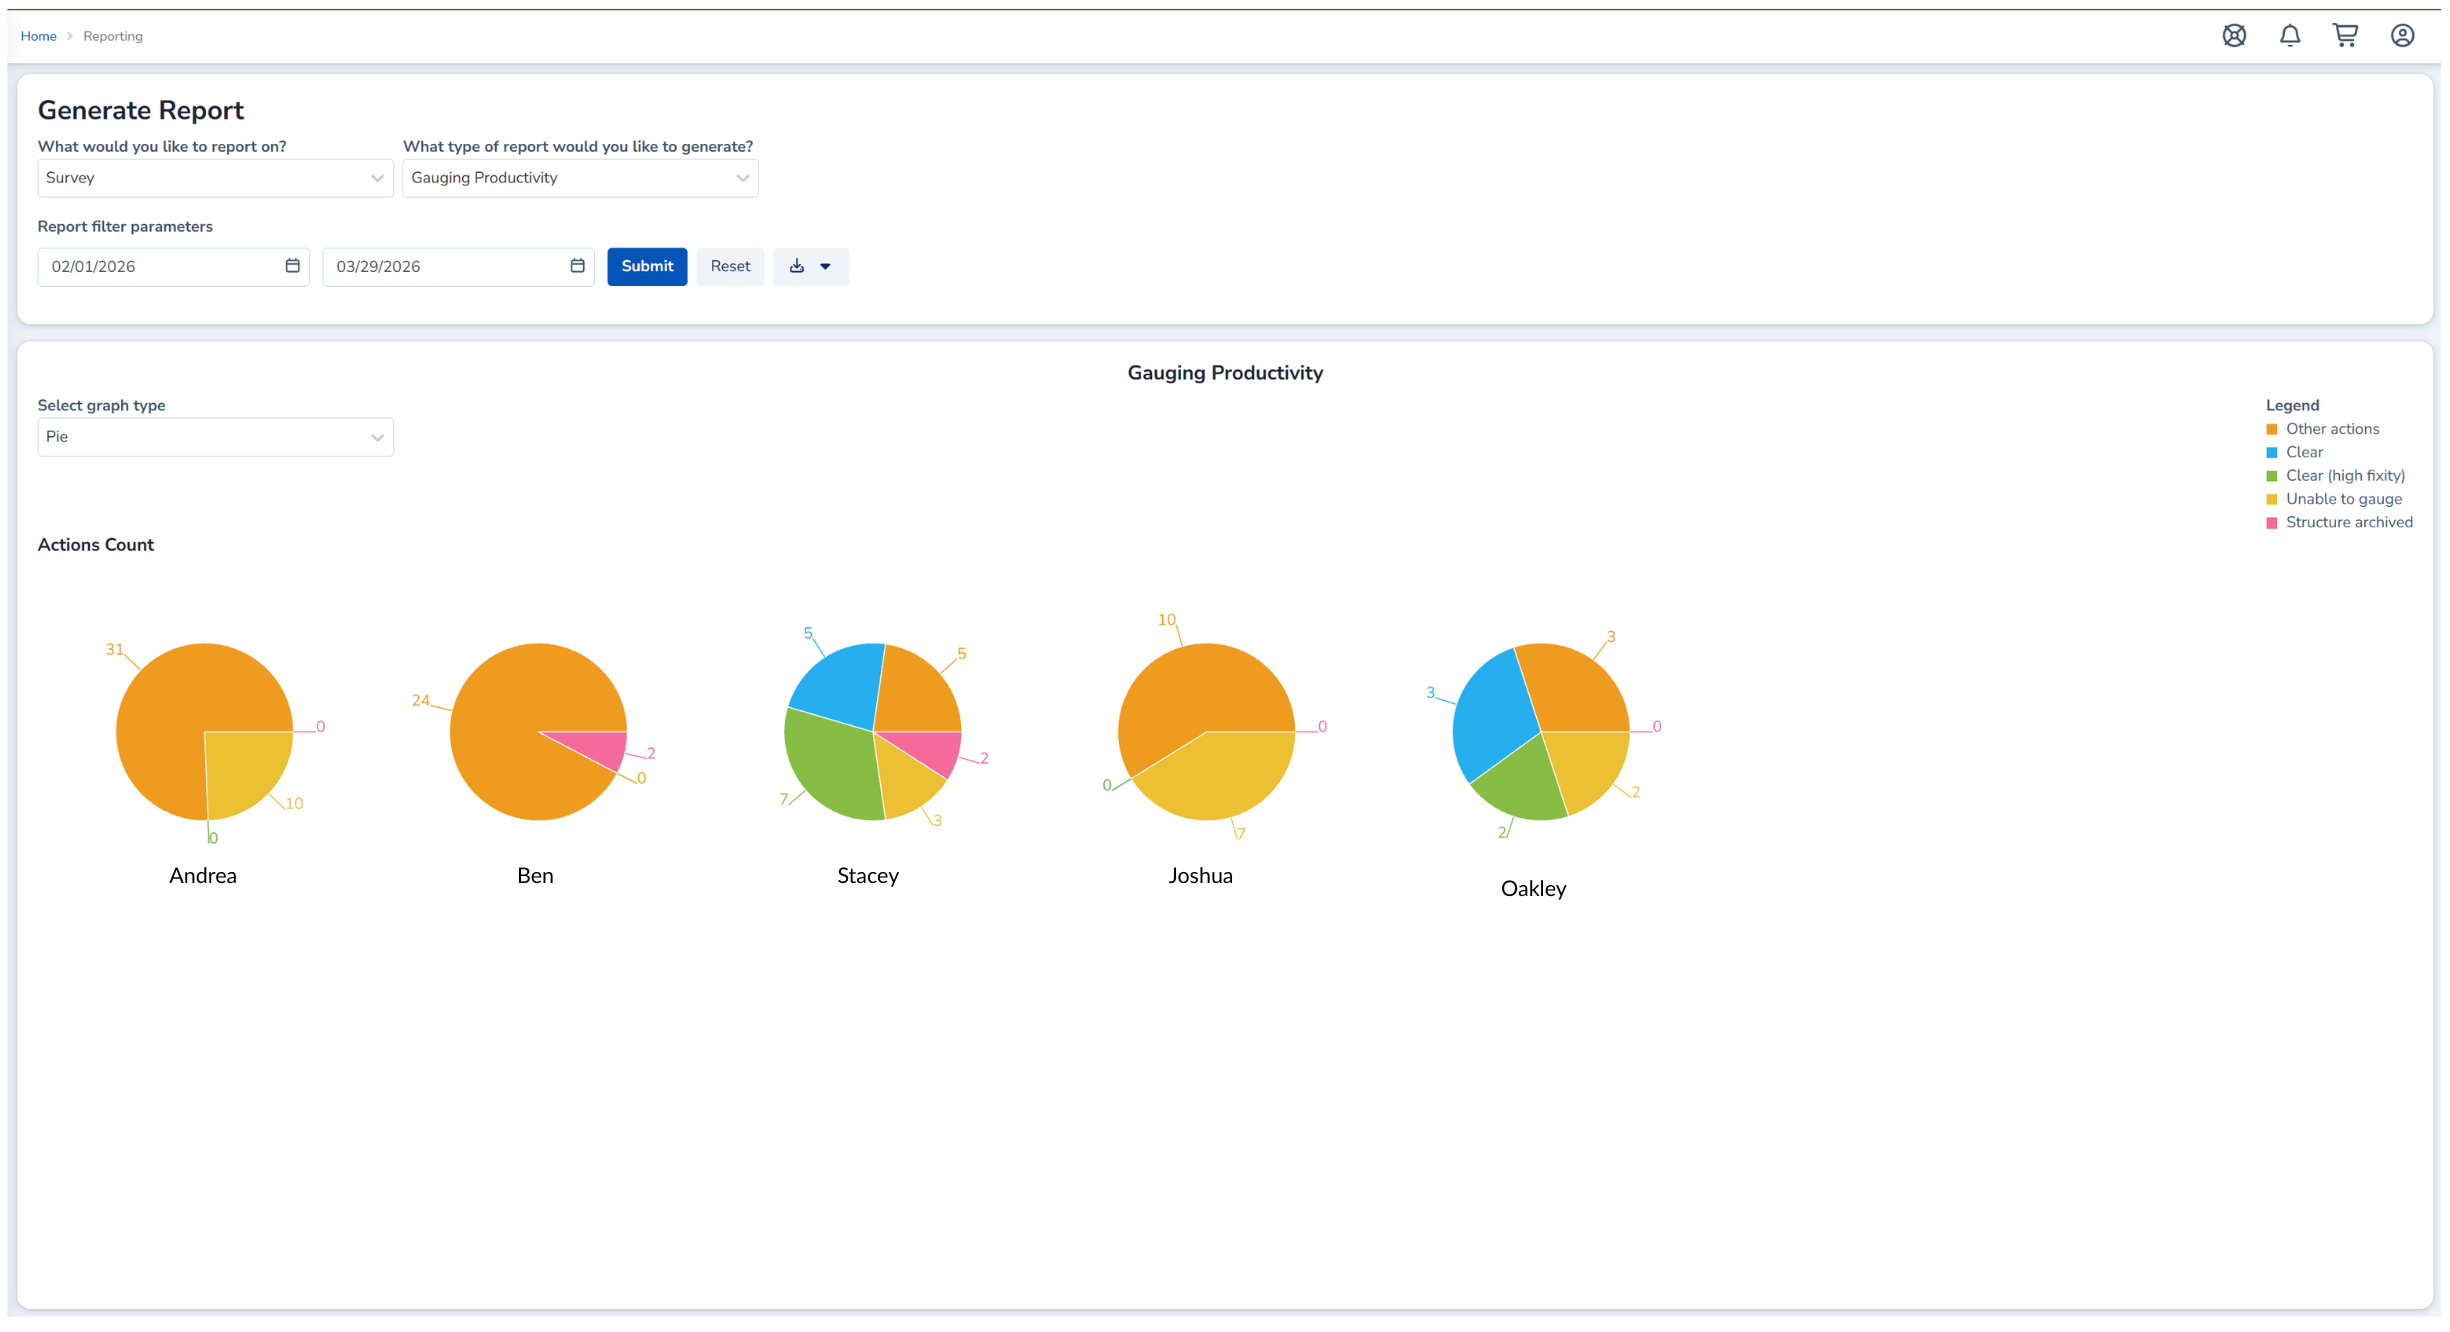
The report displays results as a user-based breakdown showing:
-
User Name/Email - Each team member who performed actions
-
Action Counts - A color-coded breakdown of activities:
|
Colour |
Action Type |
|---|---|
|
Other actions |
|
|
Clear |
|
|
Clear (high fixity) |
|
|
Unable to gauge |
|
|
Structure archived |


Ranking
Users are automatically ranked by total activity count, with the most productive team members appearing first.
Graph Type
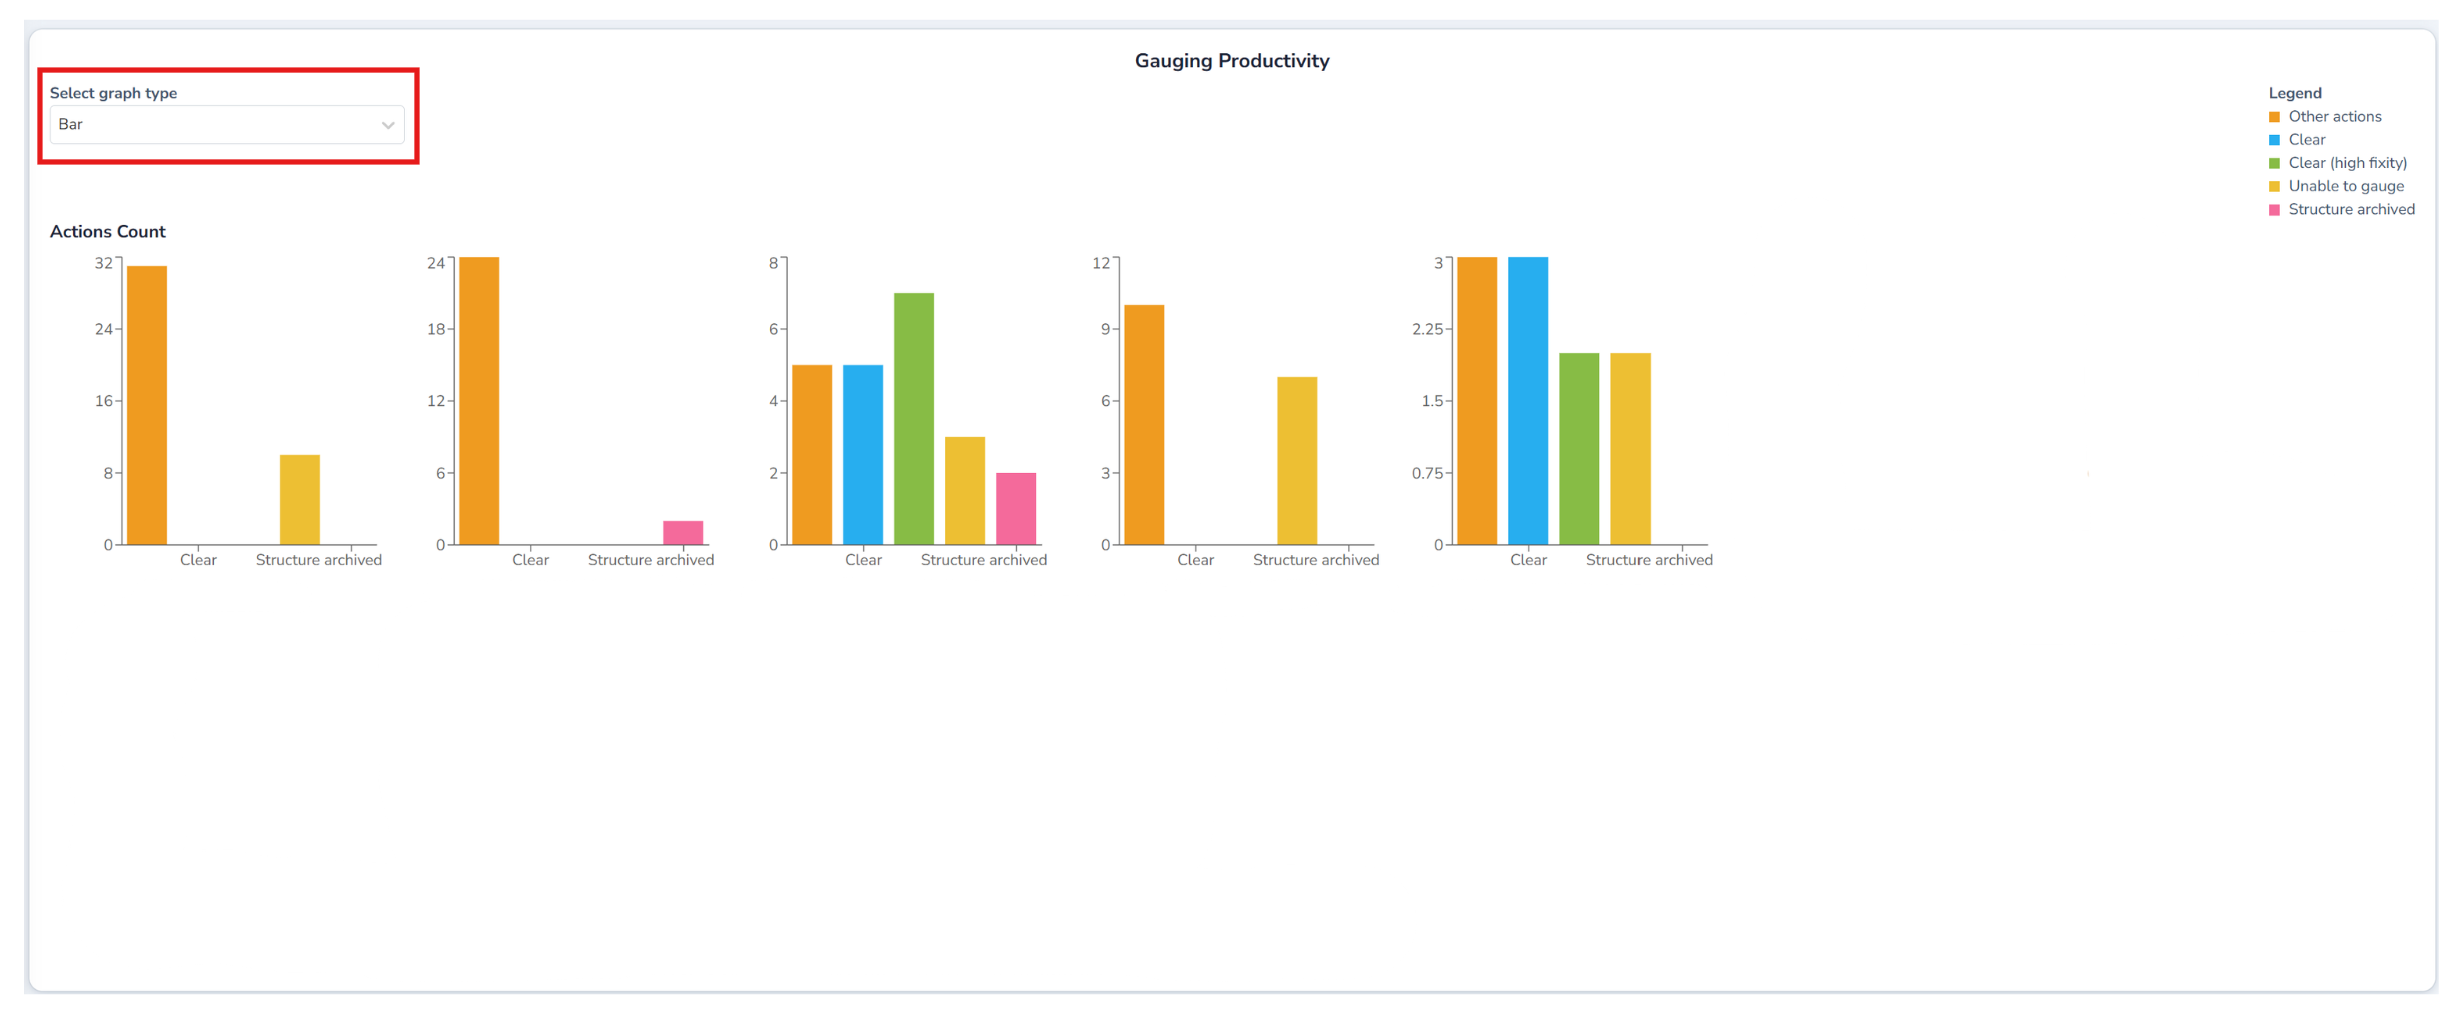
Users are able to view the Gauging Productivity Report as a pie chart, bar chart, stacked chart or table using the 'Select graph type' dropdown menu
Contents of the CSV
Inclusions and exclusions
Included:
-
Surveys that transitioned to Published within the reporting period.
-
All user actions performed on those surveys, including slice publication and structure‑level changes.
-
Structures augmented via:
-
Published slices,
-
Clear of Gauge actions,
-
High Fixity Clear actions, or
-
UTG (Unable to Gauge) actions.
-
-
Structures that were archived within the reporting period.
Excluded:
-
Surveys not published in the reporting period.
-
Work on surveys still in Draft, Prioritised, or In Review at the end of the period.
-
Any productivity assumptions or measurements taken outside RGDS.
-
Platform activity not attributable to a published survey.
Core CSV fields
The CSV includes the following data:
|
Column # |
Column Name |
Description |
|---|---|---|
|
0 |
StructureType |
Type of railway structure (e.g., Bridge, Culvert) |
|
1 |
ELR |
Electronic Line Reference |
|
2 |
StructureSubType |
Sub-classification of structure type |
|
3 |
TrackCode |
Track code identifier |
|
4 |
StartDistance |
Starting linear distance |
|
5 |
EndDistance |
Ending linear distance |
|
6 |
StructureDescription |
Human-readable structure description |
|
7 |
SurveyDate |
Date survey was conducted (dd/MM/yyyy) |
|
8 |
SurveyMethod |
Method/equipment used for survey |
|
9 |
SurveyType |
Type of survey |
|
10 |
TrackStructureId |
Unique structure identifier (TSID) |
|
11 |
Url |
Direct link to structure in Cordel Connect |
|
12 |
PublishedSurveyUrl |
Direct link to survey in Cordel Connect |
|
13 |
PublishedSurveyReference |
Survey reference number |
|
14 |
UploadedBy |
Email of user who uploaded survey |
|
15 |
PublishedStatus |
Outcome status (Edited, Clear, ClearHighFixity, UnableToGauge, Archived) |
|
16 |
CompletedDate |
Date work was completed (dd/MM/yyyy) |
|
17 |
CompletedBy |
Email of user who completed work |
|
18 |
AssignedDate |
Date survey was assigned (dd/MM/yyyy) |
|
19 |
AssignedTo |
Email of user survey was assigned to |
|
20 |
PublishedDate |
Date/time survey was published (dd/MM/yyyy) (UTC) |
|
21 |
PublishedBy |
Email of user who published survey |
Aggregation and analysis
The .CSV is a record‑level dataset that can be aggregated in third party software programs (for example, Excel or Power BI).
Typical aggregations include:
-
Total activity for a team or region.
-
Per‑person activity summaries.
-
Comparisons between
Structure Gauging Train (SGT)andOthersurvey types.
Benefits of the in‑platform report
-
Uses the same underlying logic and definitions as previous manually provided reports.
-
Is self‑serve and permission‑controlled, so authorised users can run it when needed.
-
Allows you to choose your reporting window (for example: weekly, monthly, or end‑of‑period), using day‑level date selection.
-
Removes dependency on scheduled or ad‑hoc report delivery.
Frequently asked questions
Why doesn't some work appear in the report?
The report is based on publish events:
-
If a survey was not Published within the selected date range, the associated work will not be included in that run.
-
Once the survey is published and the publish date falls inside your chosen range, its related actions will appear.
Does this report measure time spent?
No. The report measures completed actions recorded in the audit trail. It does not measure:
-
Time spent,
-
Effort,
-
Or any offline work not captured as actions in the platform.
Can we run the report weekly instead of monthly?
Yes. You can choose any date range with day‑level granularity. Many customers run:
-
Weekly reports for short‑term monitoring, and
-
Monthly or end‑of‑period reports for higher‑level review.
Can we use this report for individual performance management?
The report can be used to understand throughput at both team and individual levels. However:
-
It does not directly measure effort or time.
-
Interpretation should take into account context such as case mix, data quality, and other responsibilities.
-
If used as part of a formal performance framework, we recommend documenting how it is interpreted and combined with other information.