

The Geometry Navigator
The Geometry Navigator is the editing mode for Track Interval Surveys, accessed via Gauging > Surveys, selecting an Intervals type Survey and clicking Edit.
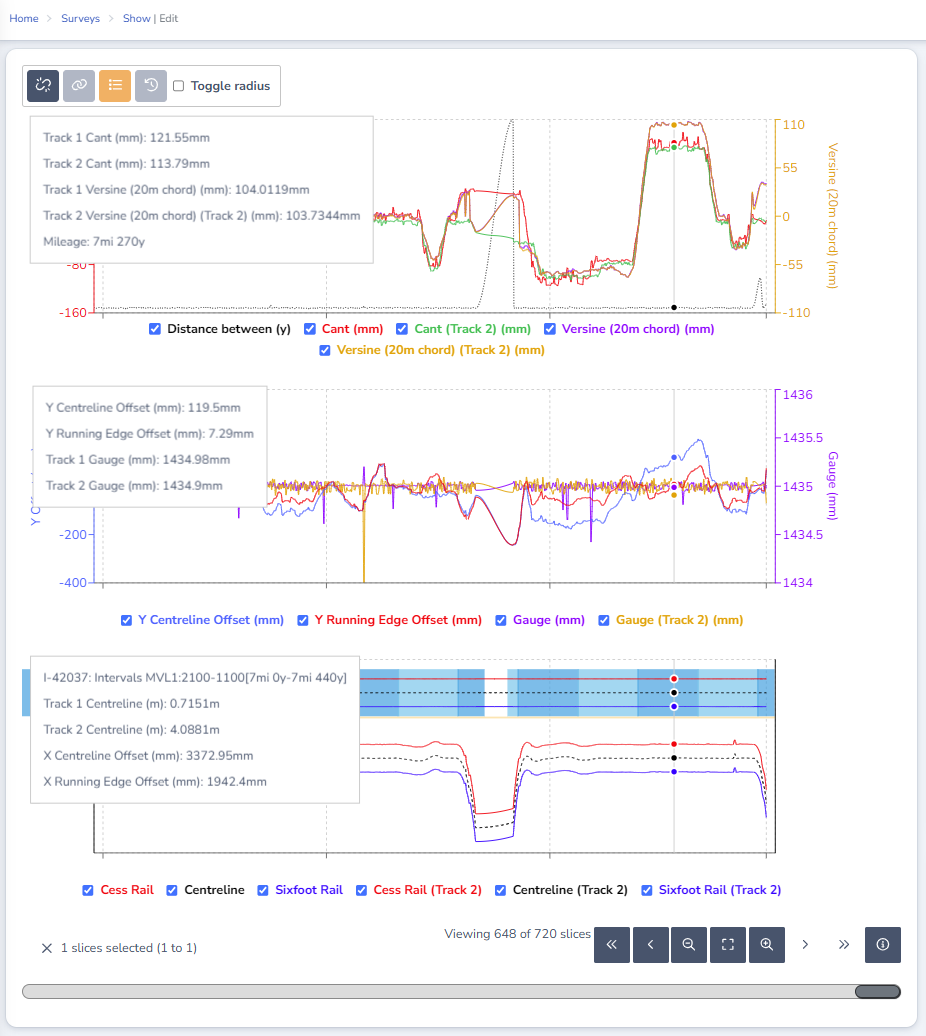
Track Geometry chart
Plots Distance between tracks, Cant (Track 1 and Track 2), and Radius (Track 1 and Track 2) across the Survey, on a dual axis (mm for Cant, m for Radius). Each series can be toggled on or off using the checkboxes below the chart.
Offset / Gauge chart
Plots Y Centreline Offset, Y Running Edge Offset, and Gauge (Track 1 and Track 2) across the Survey. Hovering over the chart shows exact values at that point, including Y Centreline Offset, Y Running Edge Offset, and Gauge for both tracks.
Rail Intervals chart
Plots Left Rail, Centreline, and Right Rail position for both tracks. Hovering over the chart shows Track 1 and Track 2 Centreline position, and X Centreline/Running Edge Offset values at that point.
Map
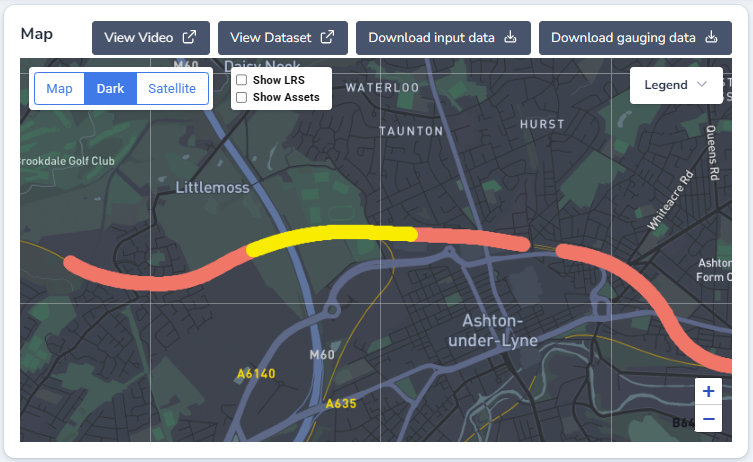
The map displays the Survey's Slices plotted along the track, with Map, Dark, and Satellite map view options.
Show LRS (Network Model) toggle displays the Network Model as a cyan path.
Show Asset toggle displays the Track Segment as a blue path.
Selected Slices are displayed as yellow map markers.
View Video
This launches the Aivr platform. Users require separate login details to access Aivr.
View Dataset
Allows users to view the mission and corresponding Forward Facing Video for the Survey the selected slices belong to.
Download Input Data
Allows users to download the original survey data for this Survey.
Download Clearance Data
Allows users to download the Cordel gauging data for this Survey.
Slice Details
Shows detail for the currently selected Slice, including Track Segment, Line Speed (Track 1 and Track 2), Track Fixity, Distance, Distance from previous Slice, and Gauge, Radius, and Cant for both tracks. Use the arrow controls to move to the previous or next Slice.
(Survey) Details
Shows Survey-level information: Reference, Name, Company, Uploader, Survey Date, and status (for example, "Ready for submission").
The Quality Assurance Summary
A log of any QA warnings, failures or passes. Uses can click on a QA warning or Failure to view the Slice that triggered the warning or failure.
Version History
Version History shows the chain of surveys submitted over time for any given section of track. This reflects distinct survey runs that have been linked together as parent and child surveys, not a log of edits made within the currently open survey.
Use Version History to see when a track section was last surveyed, or to open a previous survey for comparison.
History
Any actions performed in Cordel Connect is tracked in the Audit log.
How to add a comment to the History
To add a manual comment on a Survey:
-
Click the '+' icon in the top right hand side of the history section
-
Type the comment you wish to add
-
Click save
Note: comments that have been added to History manually can be edited by clicking the edit icon. Entries added to history by the system cannot be edited, and therefore do not display the edit icon.