

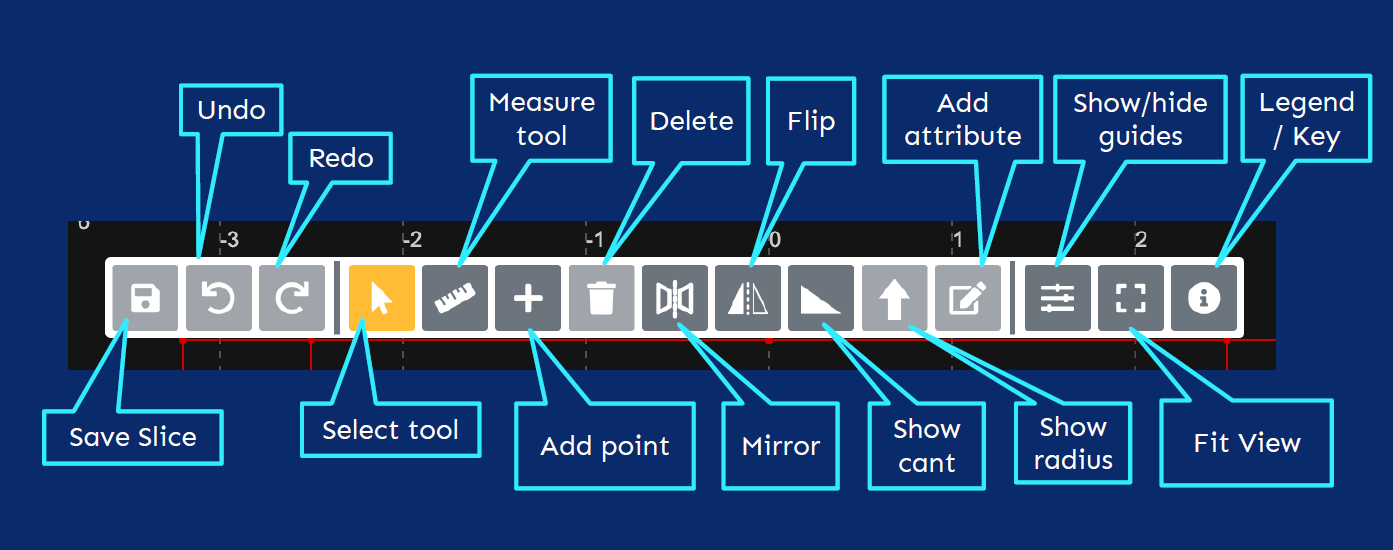
The Slice Editor toolbar provides extra functionality for configuration of the display of slice data and manual manipulation/correction of points where necessary. Common 'human-in-the-loop' slice editing activities include:
-
Refinement of structure assignment (checking/correcting structure assignment).
-
Point cleaning (removal of spurious points/noise).
-
Platform assignment using the 'Attribute 13' function.
-
Reviewing/investigation of QA warnings and failures.
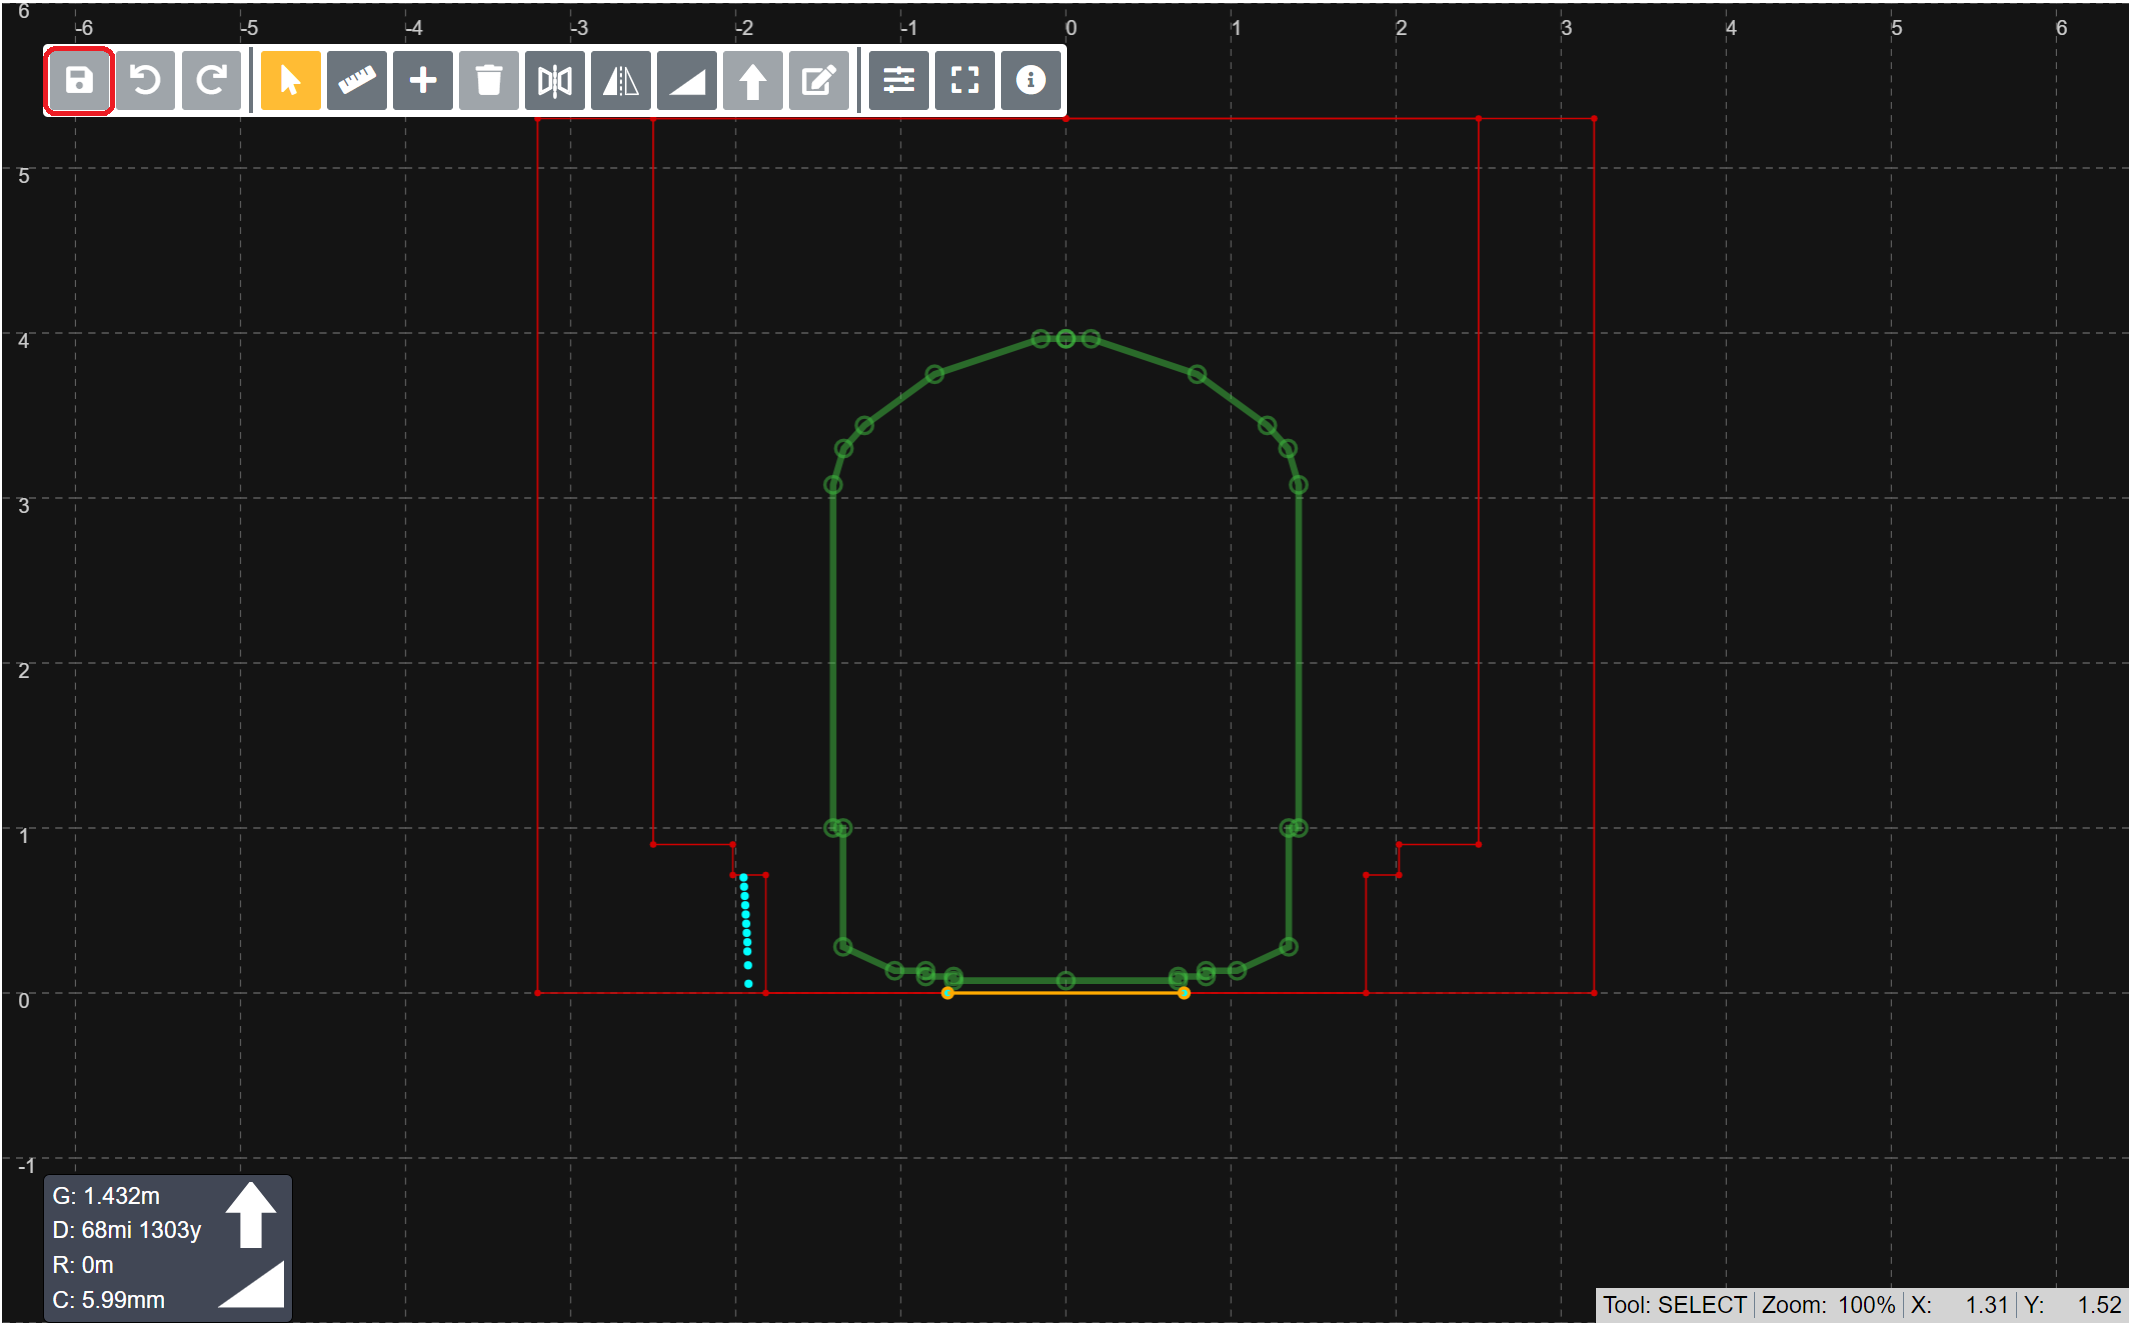
How to save in changes to a slice in Slice Viewer
The save button will save any current changes of the slice to the database. This action is only available if there are changes that have been made.
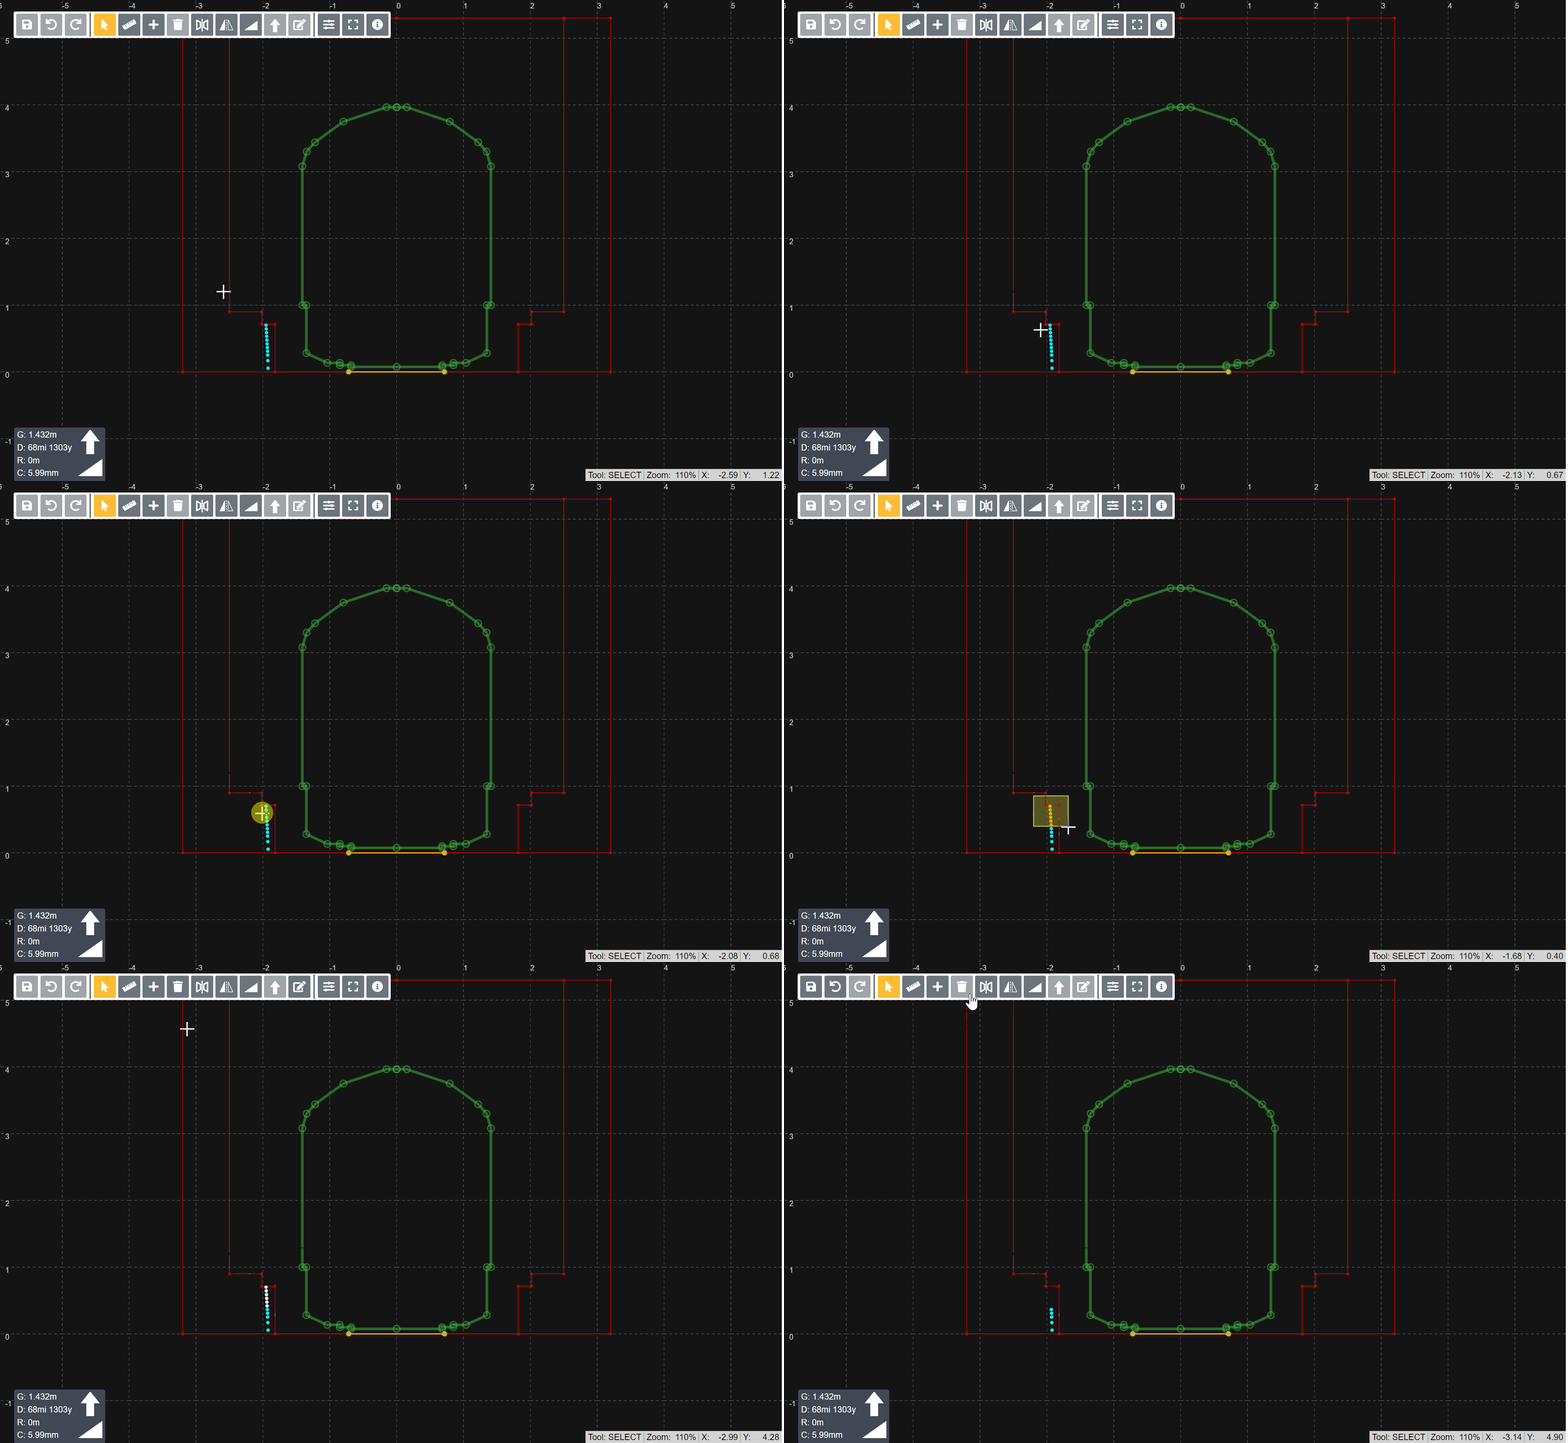
How to delete points in Slice Viewer
The delete button will remove any selected points. These changes have to be saved for changes to persist when leaving page.
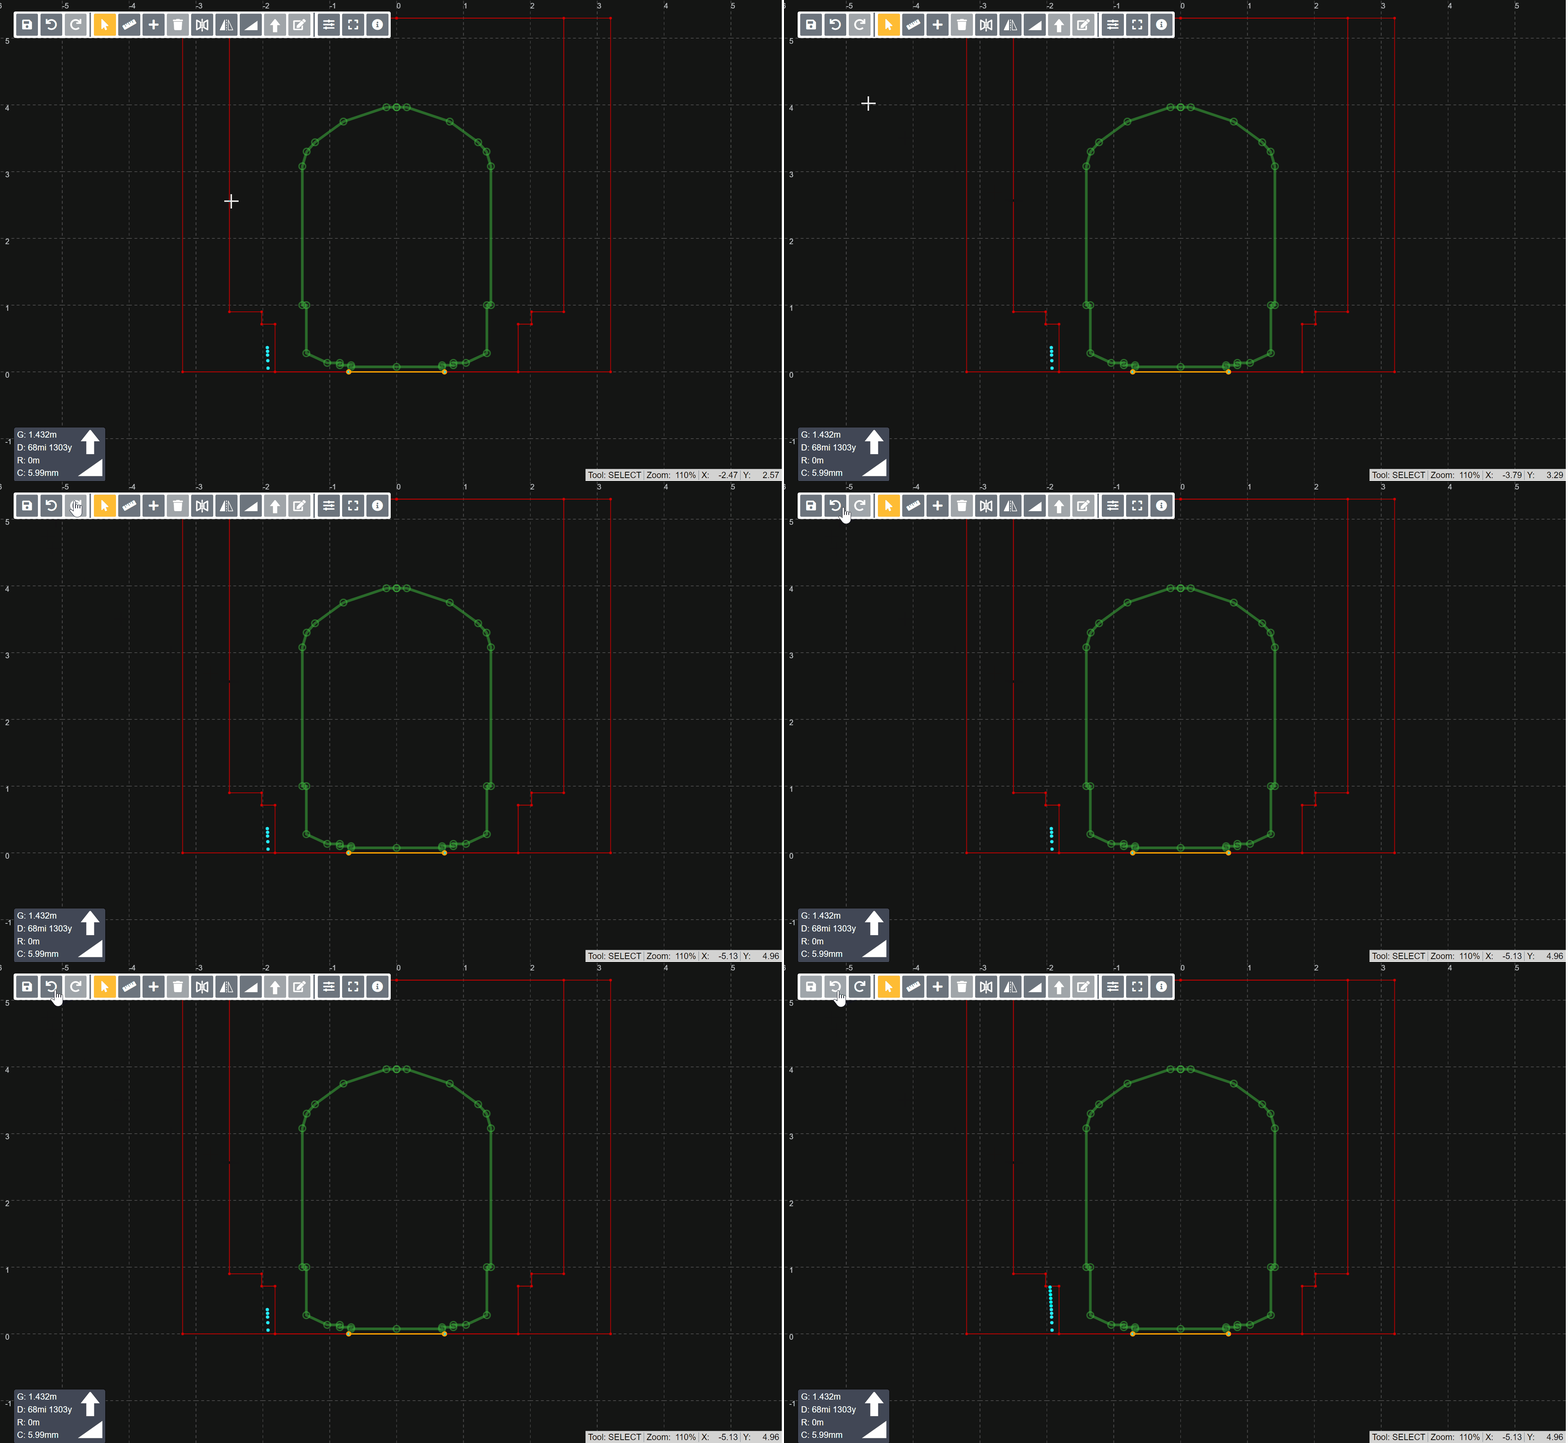
How to undo and redo actions in Slice Viewer
The undo button will undo any changes made. This acts as a stack, so multiple changes can be undone in the reverse order they were made. These changes have to be saved for changes to persist when leaving page.
The undo button will redo any undone changes. This acts as a stack, so multiple changes can be redone in the reverse order they were undone. These changes have to be saved for changes to persist when leaving page.
How to flip points using the mirror function in Slice Viewer
The mirror button will flip all points around the Y-axis. This function also updates track geometry displayed in the details tab.
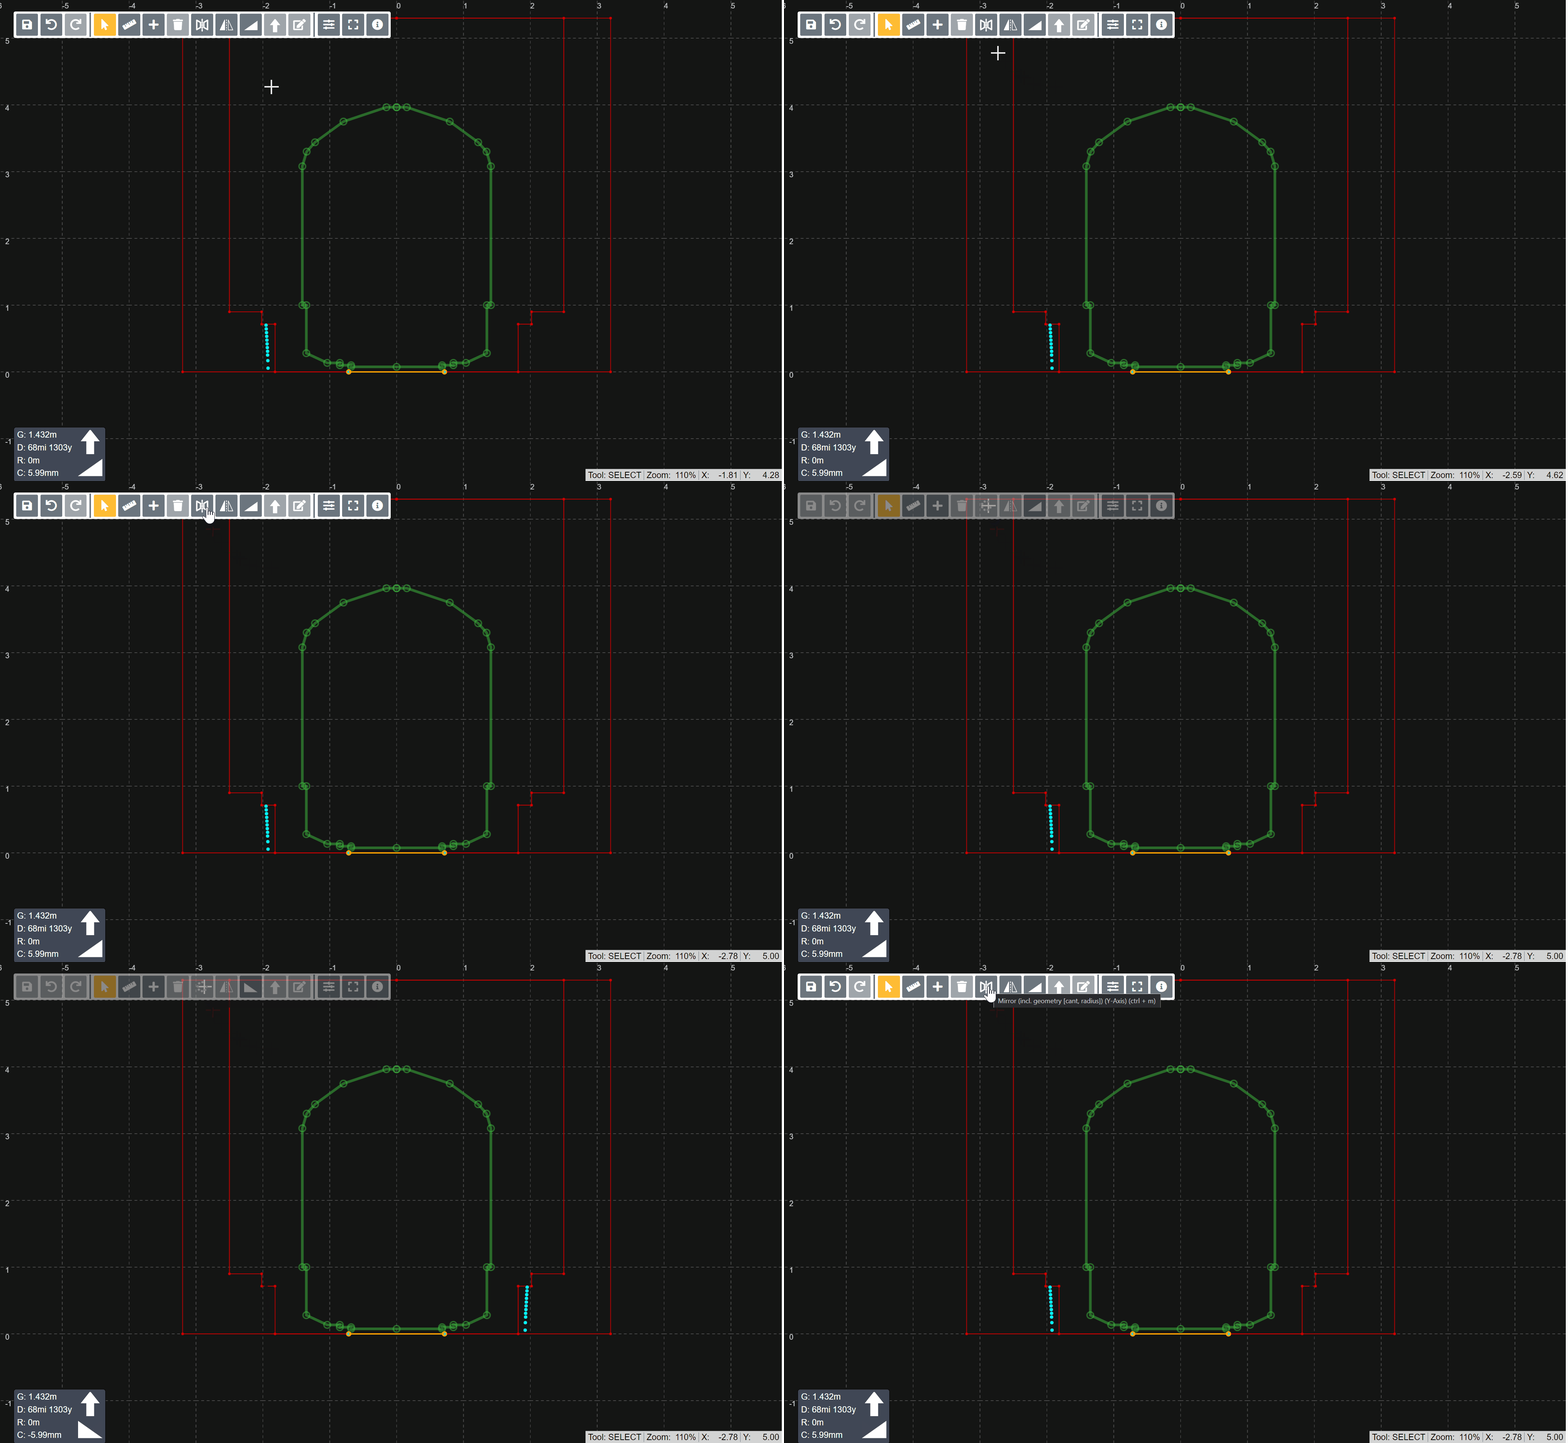
How to flip points using the flip function in Slice Viewer
The flip button will flip all points around the Y-axis. This function does not update geometry such as superelevation and radius.
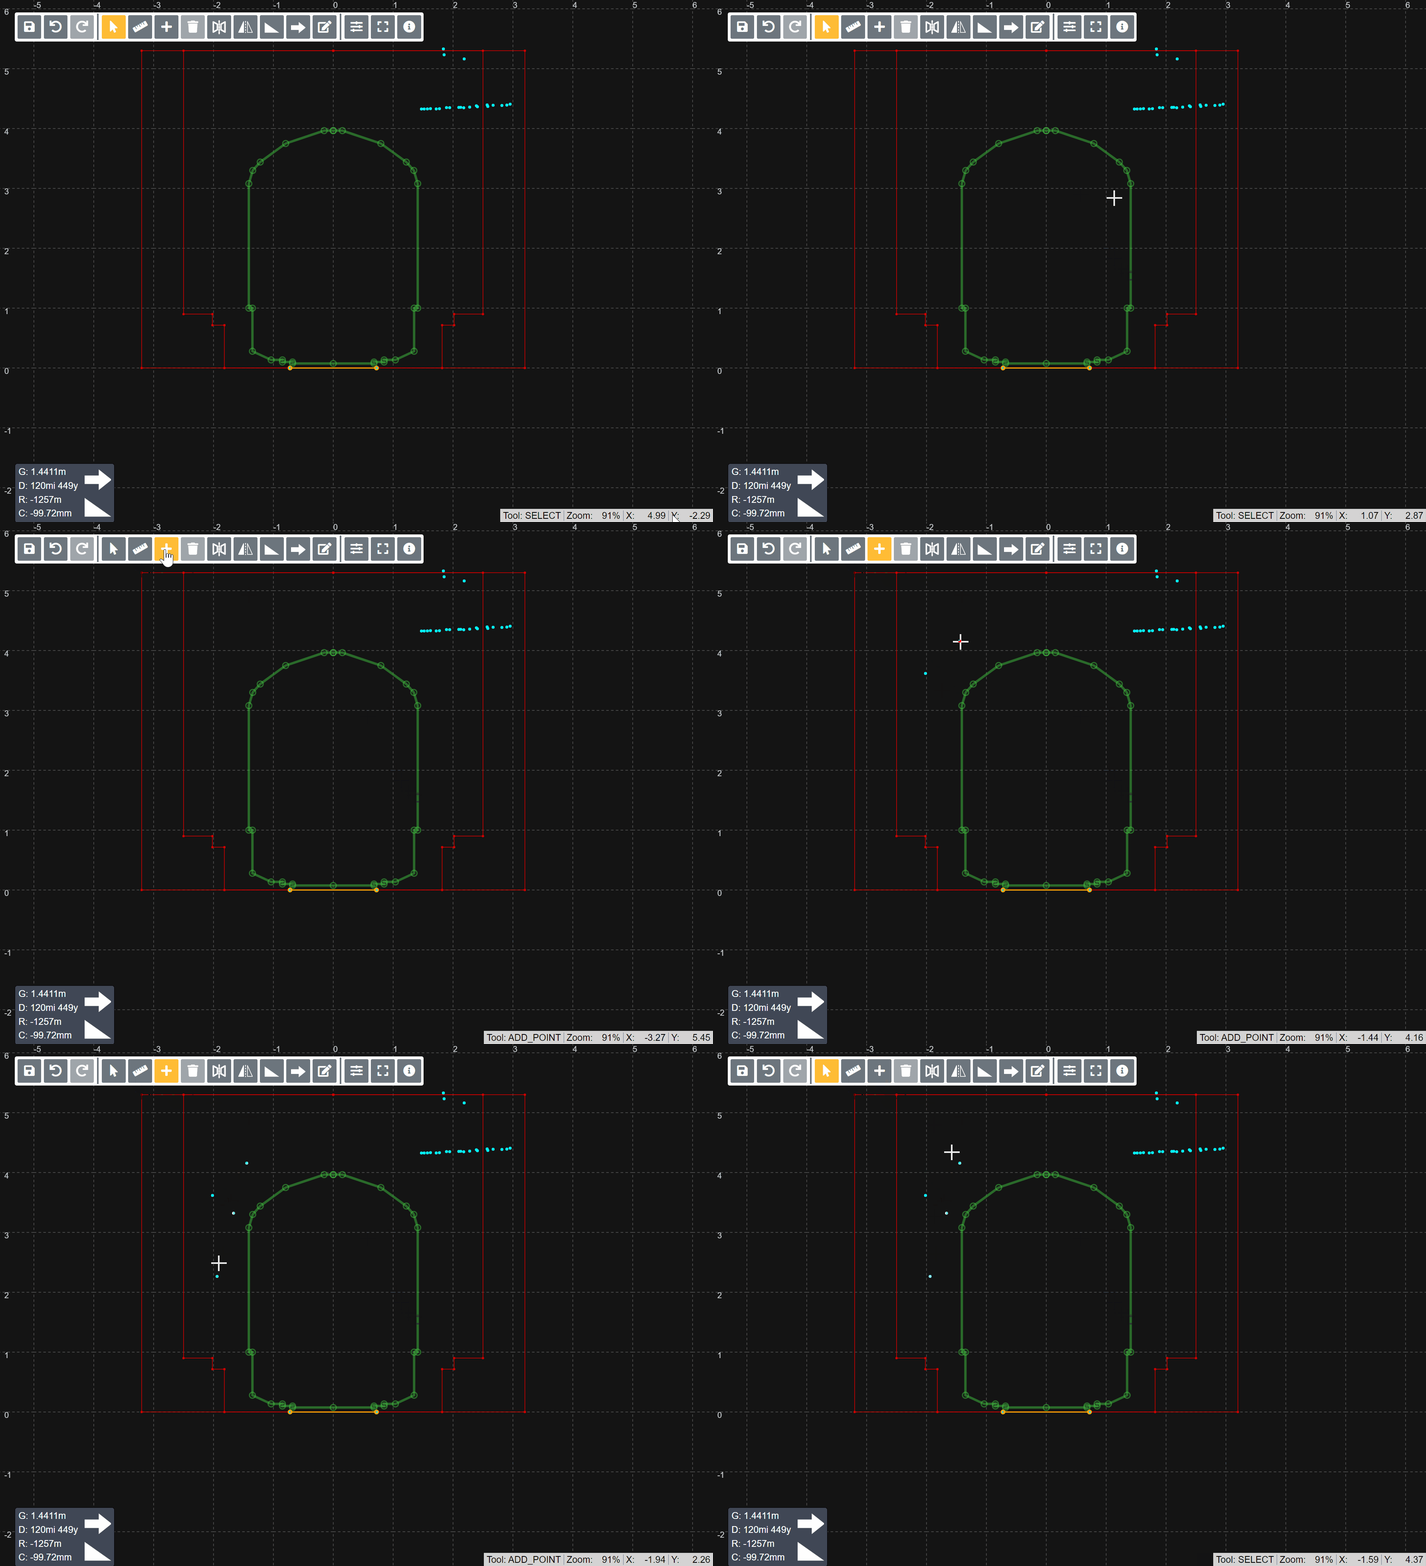
How to add a point in Slice Viewer
The add point button allows you to manually add points to the profile. The points will appear in the location that the mouse is in after you toggle on add point mode. Points can be continually added while in add point mode. Once you have finished adding points the mode can be turned off by switching to another mode in the tools section.
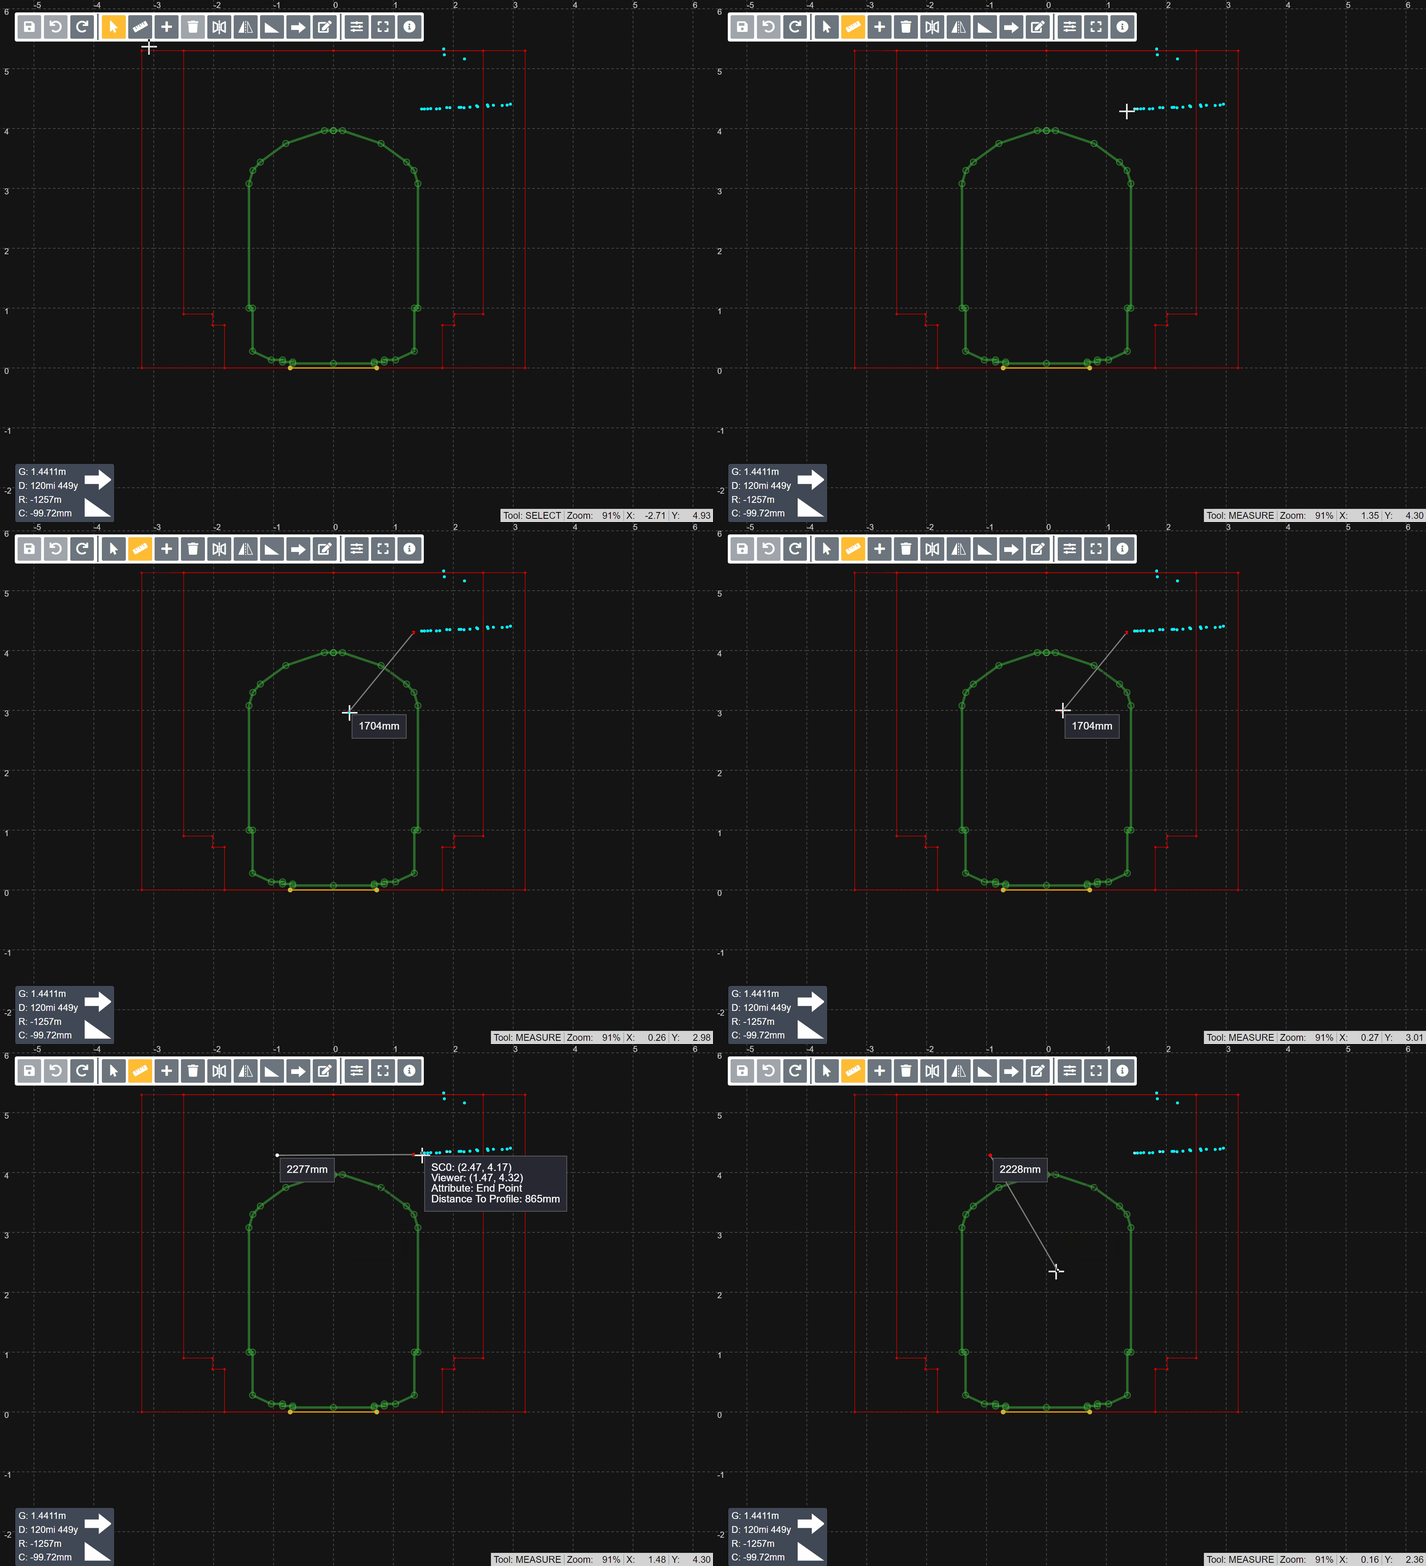
How to measure in Slice Viewer
The measure button will toggle the tool mode onto measure. In this mode, clicking anywhere on the canvas will create a measure point, and clicking again elsewhere will create a second measure point. A line is drawn between the two points giving the distance between them. This distance can also be seen after the first measure point is placed, between it and the mouse, updating as the mouse moves. A measure point can then be selected and moved, by clicking and dragging, to update the distance and point position. A measure point can also be deleted with the delete icon or shortcut (Delete key). When toggled off the tool will default back to select.
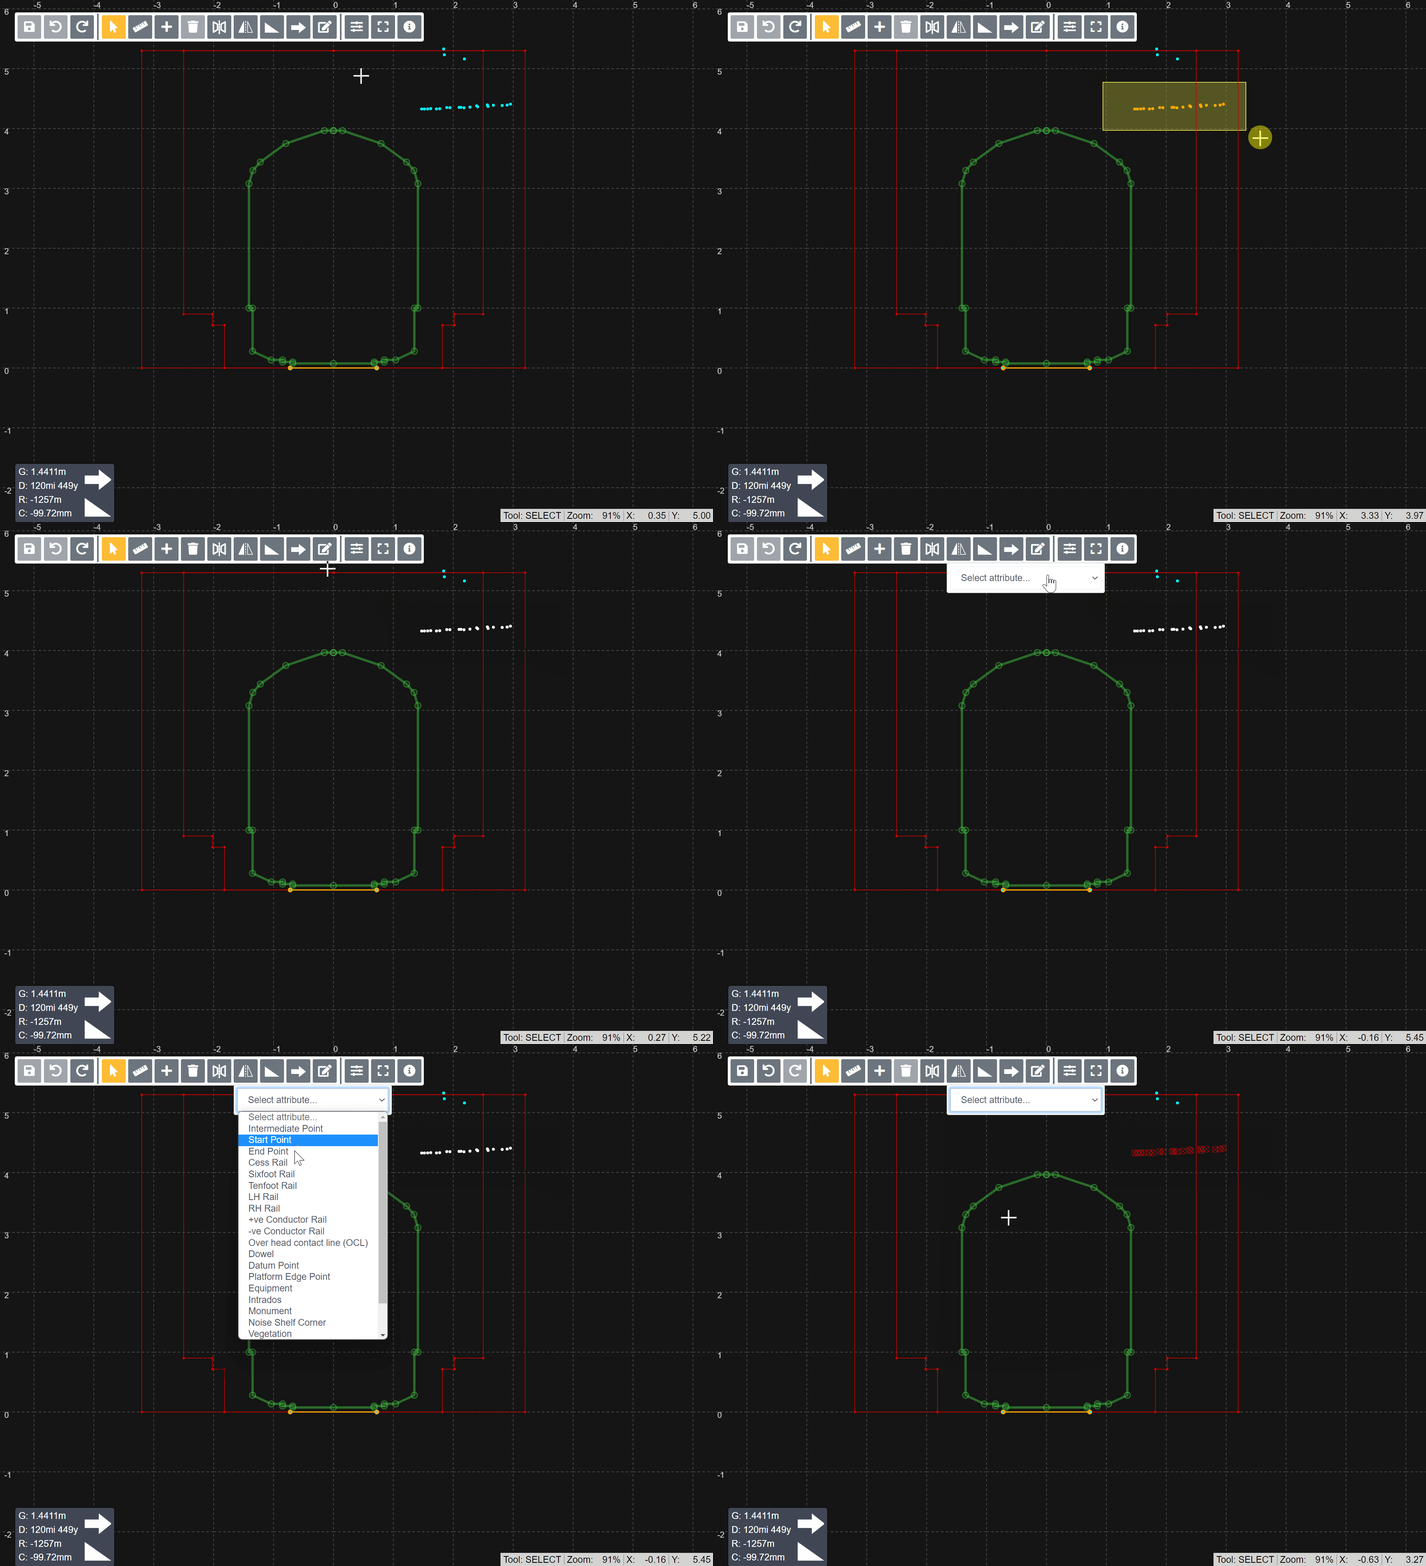
How to change the point attribute in Slice Viewer
The change point attribute dropdown allows for a selected point/s attribute to be changed to any option in the dropdown list. Some attributes have specific styles to them (different colour or icon) to represent their attributes. A legend of these styles can be seen by hovering over the Attribute Legend tooltip icon. These changes have to be saved for changes to persist when leaving page.
Slice Viewer: Options
Use the filter icon to modify the way data is displayed in Slice Viewer.
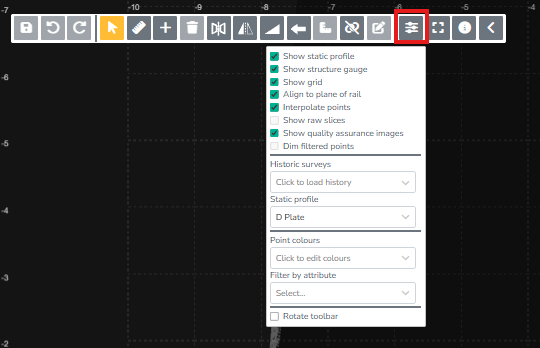
Show static profile
Toggles the green train kinematic profile on and off.
Show structure gauge
Toggles the red structure gauge outline on and off.
Show grid
Toggles the canvas grid on and off.
Align to plane of rail
Toggles the alignment of the slice between plane of rail and gravity up. Checked by default, slices show as aligned to the plane of rails so there is no tilt. Unchecking checkbox will tilt all points, reflecting real orientation of the rails.
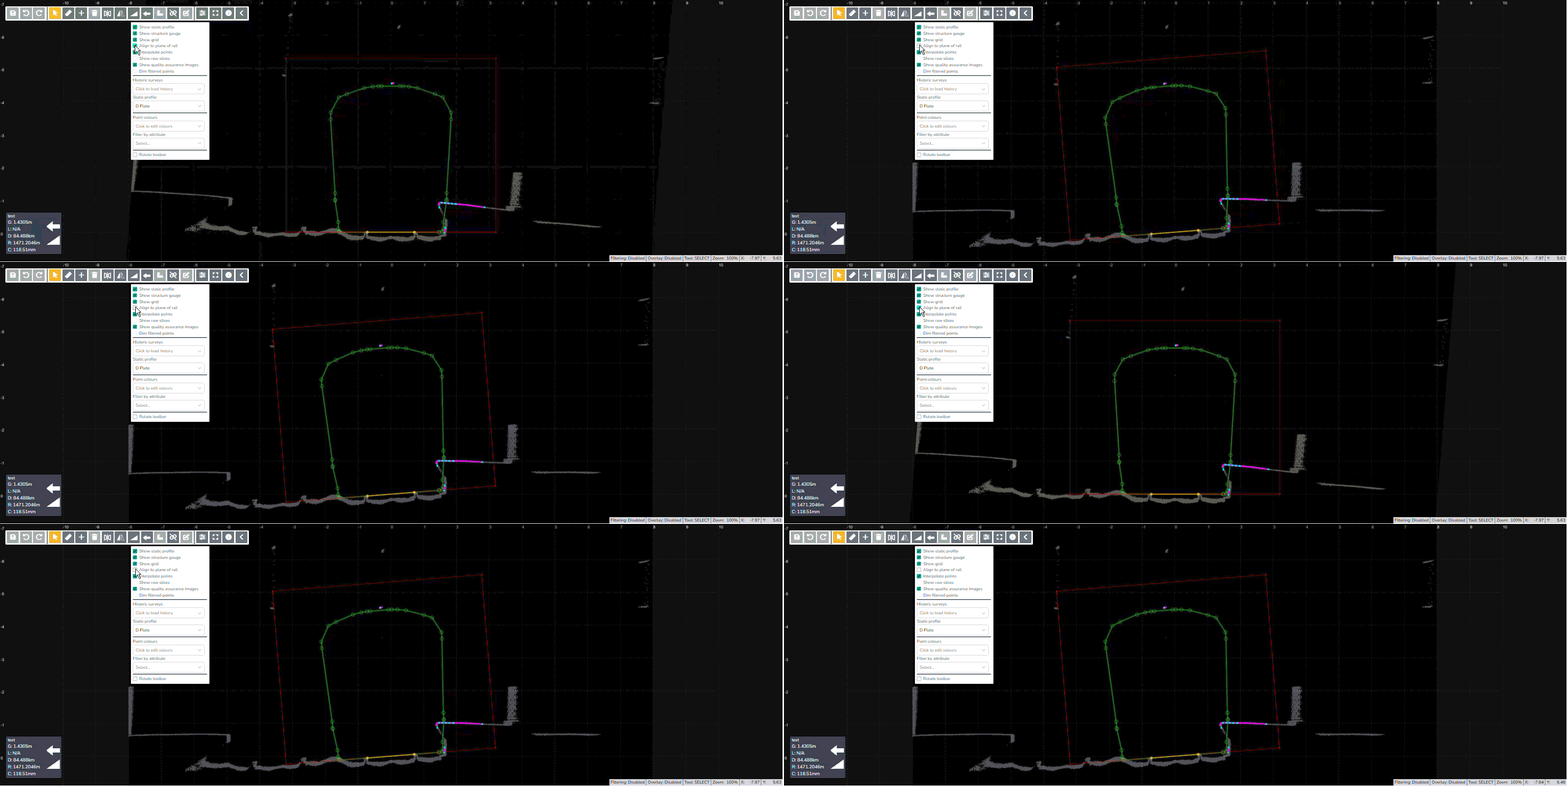
Interpolate points
Joins points into line segments in the Slice Viewer. This action does not modify the underlying point data.
Show raw slices
Toggles the display of the original, unprocessed slice points on and off. When enabled, superseded slice points are shown on the canvas in grey and are read only.
Show quality assurance images
Toggles the display of QA images on the slice canvas. QA images are PNG cross-sections generated from LiDAR data during processing and uploaded alongside the survey. When enabled, the image is rendered on the canvas as a visual reference for verifying point placement accuracy.
Dim filtered points
When filtering is active, points excluded by the filter are displayed as faded rather than hidden, preserving spatial context while highlighting the filtered set.
Historic Surveys
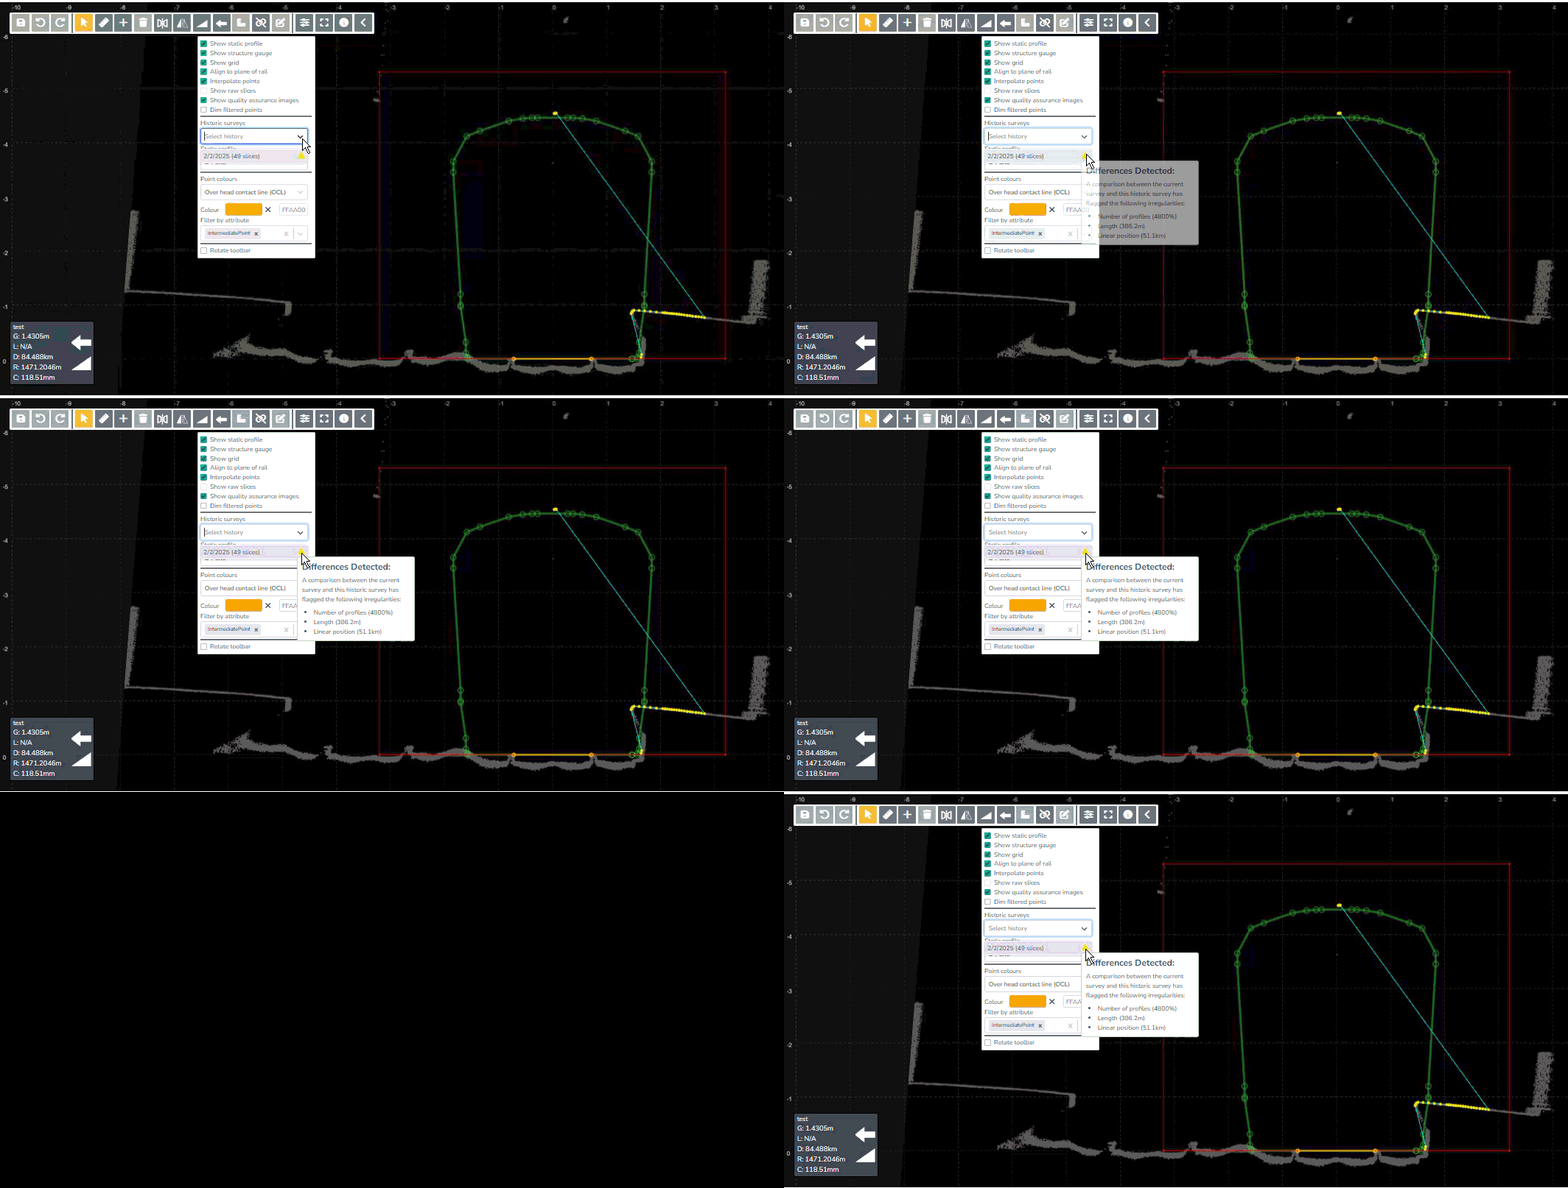
Allows users to overlay slices from historical surveys.
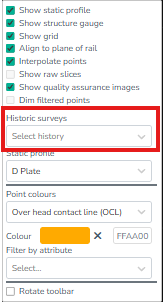
This feature also provides users with a comparison between the currently selected slice and historical slices being loaded.
Static profile
Allows users to change the kinematic profile displayed in the Slice Viewer. Selecting a different profile from the dropdown replaces the green train profile that is displayed on the canvas.
Point Colours
Allows users to customise the colour of individual point types and attributes in the viewer. Colour preferences are saved in browser storage and persist across sessions. Changes apply to the current user only and do not affect other users.
Filter by attribute
Filters the points displayed on the canvas by attribute type, showing only points that match the selected attribute. Useful for reviewing or editing specific point types in dense profiles.
Rotate toolbar
Toggles the toolbar position between the top and left side of the Slice Viewer canvas.